
PySpark Interview Questions and Answers: Senior-Level Guide
PySpark interview questions with senior-level answers, six real debugging scenarios, how to read a physical plan, and the Spark 4.x facts most guides miss. Most guides hand you definitions — but definitions are only the screening filter. Roughly two-thirds of a mid-to-senior PySpark interview is some form of "this job got slow, what do you do?", and what scores is naming the evidence you'd look for before touching a config. Inside: every core answer in screening form and senior form side by side, six real scenarios (the 3-hour regression, the one slow task, the OOM that isn't a heap problem, 50,000 tiny files, growing Kafka lag, and a design round), and the six commonly-taught answers that are actually wrong.
Quick Answer: PySpark interviews are decided by scenario questions, not definitions. Roughly two-thirds of a mid-to-senior PySpark interview is some version of "this job got slow, what do you do?" — and the honest answer is a diagnostic sequence: read the Spark UI stage summary, compare max task duration to the median, check spill and shuffle-read size, then read the physical plan with explain() before changing a single config. The definitions still get asked — repartition() vs coalesce(), cache() vs persist(), RDD vs DataFrame — but they are screening questions. What separates a hire from a no-hire is whether your answer names the evidence you would look for.
Most PySpark interview guides give you a numbered list of definitions. That will get you through a recruiter screen and then fail you in round two, because the person across the table has already read the same list and is deliberately asking something it doesn't cover.
This guide is written the other way round. It gives you the definition answers in the compressed form an interviewer actually wants, and then spends most of its length on the part that decides offers: six real diagnostic scenarios, how to read a physical plan out loud, the six commonly-taught answers that are actually wrong, and the Spark 4.x facts that instantly date a candidate who learned Spark from 2021-era content.
What PySpark interviews actually test
A PySpark interview is not testing whether you know the API. It is testing whether you can predict what the engine will do before you run it. Every question, including the definitional ones, is a proxy for that.
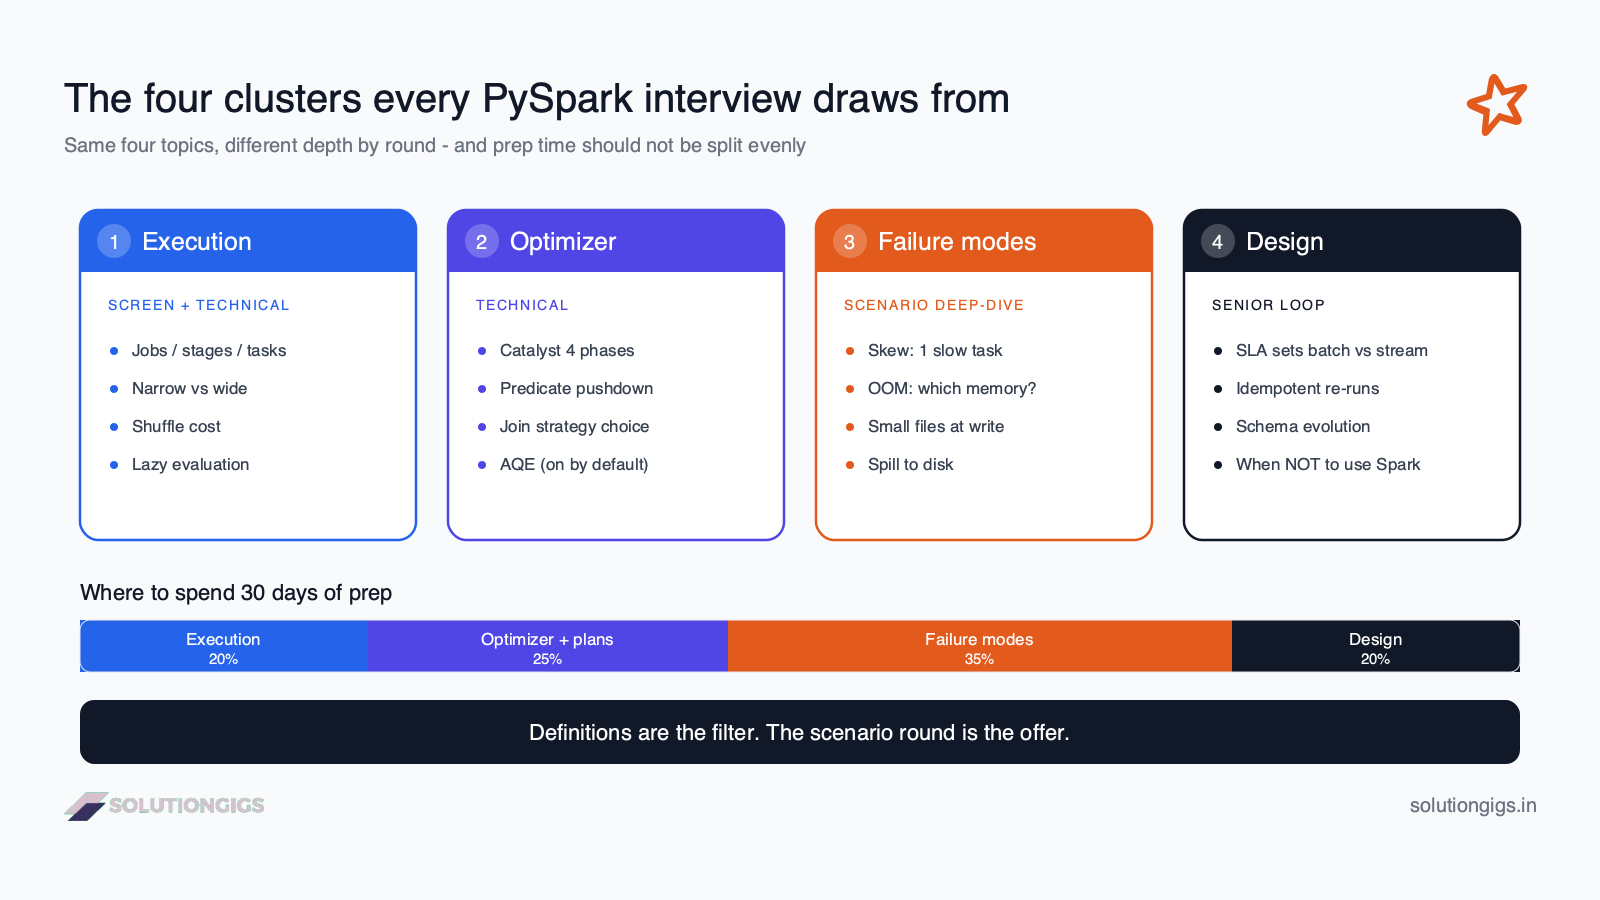
That is why the questions cluster so tightly. There are only four things an interviewer can probe:
| Cluster | The real question behind it | Typical round |
|---|---|---|
| Execution model | Do you know when work actually happens, and what crosses the network? | Screen + technical |
| Optimizer & plans | Can you predict and verify Spark's chosen plan? | Technical |
| Failure modes | Have you operated a pipeline that broke at 3 a.m.? | Deep-dive / scenario |
| Design judgement | Do you know when not to reach for Spark? | Design / senior loop |
Candidates over-prepare cluster one and under-prepare clusters three and four. Cluster one is where the free content is; clusters three and four are where the salary band is decided.
What gets asked at your experience level
Interviewers calibrate hard by years of experience. Preparing for the wrong band wastes weeks.
| Experience | What dominates the interview | What is not asked much |
|---|---|---|
| 0–2 years | DataFrame API, transformations vs actions, joins, window functions, basic partitioning | Cluster sizing, cost, streaming state |
| 3–6 years | Shuffle behaviour, join strategies, skew, OOM, file layout, reading plans | Multi-team platform design |
| 7+ years | Cost per job, SLA design, backfills, schema evolution, when to use Spark at all | Syntax trivia |
A senior candidate who answers junior questions in junior depth reads as a junior. If you have six years of experience and you answer "what is
cache()" with only the definition, you have skipped the part they were listening for — when you decided not to cache.
Core PySpark interview questions
For each of these, I've written the screening answer (what unlocks the next question) and the senior answer (what actually scores). The gap between them is the whole point of this guide.
1. What is the difference between RDD, DataFrame and Dataset?
Screening answer: An RDD is a distributed collection of objects with no schema and no query optimization. A DataFrame is a distributed table with a schema, executed through the Catalyst optimizer and Tungsten's off-heap memory format. A Dataset is a typed DataFrame, and it exists only in Scala and Java — in PySpark there is no Dataset API, because Python has no compile-time type information for Spark to use.
Senior answer adds: the reason it matters is that the DataFrame API is declarative, so Spark can rewrite it — push filters down, prune columns, switch join strategies at runtime. RDD code is imperative, so Spark must run exactly what you wrote. That's why "use DataFrames unless you genuinely need row-level control over partitions" is the rule, and why dropping to RDDs silently disables the optimizer.
The follow-up they're waiting for: when would you still use an RDD? Good answers: custom partitioners, zipWithIndex-style operations with no DataFrame equivalent, or interacting with legacy code. Saying "never" is a weaker answer than naming one real case.
2. What is the difference between cache() and persist()?
Screening answer: cache() is persist() with the default storage level. Both are lazy — nothing is stored until an action runs.
Senior answer adds the gotcha: the default differs by API. For a DataFrame, cache() means MEMORY_AND_DISK, so partitions that don't fit spill to disk. For an RDD, cache() means MEMORY_ONLY, so partitions that don't fit are simply recomputed on every access. That single difference has caused more mysterious slowdowns than almost anything else in Spark.
Then invert the question, which almost nobody does: caching is only justified when a DataFrame is consumed by more than one action. On our own platform, the largest single win from a caching review came from removing caches — they were holding memory that the shuffle needed, pushing the job into spill. If you want the full storage-level matrix, we broke it down in cache() vs persist().
3. repartition() vs coalesce() — and the trap
Screening answer: repartition() does a full shuffle, can increase or decrease partitions, and gives even sizes. coalesce() avoids the shuffle by merging existing partitions, can only decrease, and can leave you with uneven partitions.
Senior answer names the trap: coalesce() doesn't just merge output partitions — it reduces the parallelism of the stage that produces them. df.coalesce(1).write(...) does not run your transformation on 200 cores and then merge; it runs the whole upstream stage on one core. To write a single file you want repartition(1), which keeps upstream parallelism and pays for one shuffle at the end.
This is the highest-frequency wrong answer in PySpark interviews. Full treatment: repartition() vs coalesce().
4. What is the difference between a narrow and a wide transformation?
Screening answer: A narrow transformation (filter, map, select, withColumn) computes each output partition from exactly one input partition, so it needs no data movement. A wide transformation (groupBy, join, distinct, orderBy, repartition) needs rows from many input partitions, which forces a shuffle — data is written to local disk, sent over the network, and read by the next stage.
Senior answer adds the operational consequence: wide transformations are where stage boundaries come from. Stages are separated by shuffles, one-to-one. So when you look at a job with seven stages, you are looking at six shuffles, and the question "can I remove one?" is usually the highest-leverage optimization available — higher than any memory config.
5. Why is a shuffle expensive?
Screening answer: because it serialises data, writes it to local disk, transfers it over the network, and then sorts or hashes it on the read side — and every task must wait for the write side of the previous stage to finish.
Senior answer quantifies it: the cost scales with the number of partition pairs, not just data volume. A shuffle from 1,000 map partitions to 1,000 reduce partitions creates one million shuffle blocks, which is why a shuffle of a modest dataset with a huge partition count can be slower than a shuffle of a bigger dataset with sane partitioning. That's the reasoning behind adaptive query execution coalescing shuffle partitions at runtime.
6. Explain lazy evaluation. Why does Spark do it?
Screening answer: transformations build an unexecuted logical plan; only an action (count, collect, write, show) triggers execution. Laziness is what lets Catalyst see the whole pipeline at once and optimize across it — pushing filters to the scan, pruning unused columns, collapsing projections.
Senior answer adds the practical bite: laziness is also why timing a PySpark line tells you nothing, why an error surfaces on a line far from its cause, and why df.count() used as a "checkpoint" quietly re-executes the entire lineage unless the DataFrame is cached or checkpointed.
Spark SQL and optimizer questions
7. What is the Catalyst optimizer, in one breath?
Catalyst is Spark SQL's rule-based and cost-based query optimizer: it turns your DataFrame code into an unresolved logical plan, resolves it against the catalog, applies rewrite rules, then chooses physical operators and generates JVM bytecode. The four stages — analysis, logical optimization, physical planning, code generation — are the answer to the question as asked.
The follow-up is what matters: which rules should you be able to name? Predicate pushdown, column pruning, constant folding, and partition pruning. Those four are the ones you can see in a plan, which makes them the ones you can prove you understand.
8. What is AQE, and is it enabled by default? (the version trap)
Adaptive query execution re-optimizes a query at runtime using statistics from completed shuffle stages, instead of committing to a plan built from stale table statistics. It does three main things: coalesces small shuffle partitions, converts a sort-merge join to a broadcast join when a side turns out to be small, and splits skewed partitions in a join.
Here is the trap. A very large amount of the PySpark content online says AQE arrived in Spark 3.0 and must be enabled with spark.sql.adaptive.enabled=true. That was true for Spark 3.0 and 3.1. Since Spark 3.2 (SPARK-33679) it has been on by default. If you tell a 2026 interviewer that the first thing you'd do is switch AQE on, you've told them when you learned Spark.
The senior version of the answer: "AQE is on by default since 3.2, so I'd first check it hasn't been disabled by an inherited config, then look at whether spark.sql.adaptive.skewJoin.enabled and coalescePartitions are actually firing — the Spark UI shows the plan Spark ended up with, and AQE-rewritten nodes are marked." Deeper dive: Spark Adaptive Query Execution.
9. What join strategies does Spark have, and how does it choose?
Spark picks between broadcast hash join, sort-merge join, shuffle hash join, and — for joins with no equality condition — broadcast nested loop or cartesian product. The decision is driven by estimated size: if one side is below spark.sql.autoBroadcastJoinThreshold (10 MB by default), Spark broadcasts it and skips the shuffle entirely; otherwise it shuffles both sides and sort-merges.
The scoring detail: that threshold is checked against Spark's estimate, not the true size. With no table statistics — very common on files in a data lake — the estimate can be wildly wrong, which is exactly why AQE's runtime re-check exists. Naming that gap is the answer. See Spark join strategies for the full decision tree.
10. Why are Python UDFs slow, and what do you use instead?
A plain Python UDF forces Spark to serialise each row from the JVM to a Python worker process, run your function, and serialise the result back — so you pay per-row serialisation and you lose Catalyst's ability to optimize through the function, which becomes an opaque black box.
The preference order to state:
- Built-in functions from
pyspark.sql.functions— these run in the JVM with whole-stage code generation. Almost everything you want already exists. - Pandas UDFs / Arrow-optimized UDFs — data moves in Arrow batches instead of row by row, so serialisation cost is amortised and the function operates on a vectorised
pandas.Series. - A plain Python UDF — only when the logic genuinely cannot be expressed either way.
A good closing line: "the fastest UDF is the one I deleted after finding the built-in."
The scenario round: where offers are decided
This is the section that separates this guide from the lists. Every question below is a paraphrase of something real, and in each case the interviewer is scoring your sequence, not your conclusion. Guessing the right fix immediately is a worse answer than naming the evidence and arriving at it.
The universal opening move, which works for all six: "before I change any config, I'd look at the Spark UI stage that's actually slow and compare max task duration to the median, then check shuffle read/write and spill." That one sentence signals operational experience more than any definition.
Scenario 1: "This job ran in 20 minutes last month. It now takes 3 hours. Nothing changed in the code."
Since the code didn't change, the data did. Work through it in this order:
- Volume or shape? Total input size versus row count per partition. A 3× data increase causing a 9× slowdown means you've crossed a threshold, not scaled linearly.
- Did a broadcast stop being a broadcast? This is the single most common answer. A dimension table grew past
autoBroadcastJoinThreshold, so a broadcast hash join silently became a sort-merge join with two full shuffles. Check the plan forSortMergeJoinwhere you expectBroadcastHashJoin. - Spill. If shuffle spill (memory and disk) is now non-zero, the stage no longer fits and you're paying disk round trips.
- File count. Did an upstream job start producing many small files? Task count exploding with tiny input per task points here.
The crossed-threshold framing is what a senior candidate brings: performance cliffs in Spark are usually discrete, not gradual.
Scenario 2: "199 tasks finished in 30 seconds. One task has been running for 40 minutes."
This is data skew, and the answer is expected to be fluent. One key — very often null, an empty string, a default unknown tenant, or a single whale customer — holds a disproportionate share of the rows, so one partition is enormous.
State the fixes in escalating order, because reaching for the exotic one first is a red flag:
- Confirm it with a
groupBy(key).count().orderBy(desc("count"))on the join key, and look at the stage's task-duration distribution. - Let AQE handle it —
spark.sql.adaptive.skewJoin.enabledsplits skewed partitions automatically. Check whether it fired before doing anything manual. - Filter the junk key if the skew is
nullor a sentinel that shouldn't be joined at all. Frequently the whole problem. - Broadcast the small side if it fits, which removes the shuffle and therefore the skew.
- Salt the key — add a random suffix to the hot key on the large side and explode the small side to match. Powerful, but it complicates the code, so it's the last resort.
Full walkthrough with code: Spark data skew.
Scenario 3: "The job dies with ExecutorLostFailure and an OOM in the logs. Do you increase executor memory?"
Answer "not yet" — this is a trap question and the expected answer is a diagnosis, not a config bump. Raising spark.executor.memory is the reflex they're testing for.
Ask which memory ran out, because the fixes are different:
- Executor JVM heap OOM during a shuffle → too much data per task. The fix is more partitions, not more memory per executor.
- Driver OOM → almost always a
collect(), atoPandas(), or a broadcast of something far too large. More driver memory is treating the symptom. - Container killed by YARN/Kubernetes for exceeding limits → this is off-heap overhead, so
spark.executor.memoryis the wrong knob entirely; you wantmemoryOverhead, and Python-heavy workloads need it because PySpark worker processes live outside the JVM.
That last distinction — that a PySpark job's Python processes consume overhead memory, not heap — is a strong senior signal. See Spark out of memory errors and executor tuning.
Scenario 4: "Your daily job writes 50,000 files of 40 KB each. What's wrong and how do you fix it?"
Output file count equals the number of write-side partitions multiplied by the number of distinct partition-column values. So 200 shuffle partitions writing into 250 date partitions gives you 50,000 files, each tiny.
Why it hurts: every downstream read pays a file-open and metadata round trip, so listing and planning dominate actual scanning — and on object storage, that's a network call per file. The fix is repartition() on the partition columns immediately before the write, so each output partition is written by one task:
(df.repartition("event_date")            # one writer task per date
   .write
   .partitionBy("event_date")
   .mode("append")
   .parquet("s3://lake/events/"))
Target 128 MB–1 GB per file. The advanced follow-up is compaction on the table format — see the small files problem and partitioning strategies.
Scenario 5: "The streaming job's Kafka consumer lag grows all day and recovers overnight."
Lag growing while input is high and shrinking when input drops means throughput is below peak input rate — the job is under-provisioned for peak, not broken.
What to check, in order: batch duration versus trigger interval (if processing takes longer than the trigger, you can never catch up); whether the number of Kafka partitions caps your parallelism, since one Kafka partition maps to one task; whether state is growing without bound because a watermark is missing or too generous; and maxOffsetsPerTrigger, which limits admission per batch and can itself be the ceiling.
Related: Kafka consumer lag explained and Spark streaming tuning.
Scenario 6: "Design a pipeline that ingests 500 GB/day of clickstream and serves dashboards."
The design round rewards stating your assumptions and your SLA first. A structure that works:
- Clarify freshness (hourly? one minute?), query pattern, and retention. Freshness alone determines batch versus streaming.
- Ingest to raw storage in an append-only, replayable form — the ability to reprocess is worth more than any transformation cleverness.
- Layer raw → cleaned → aggregated, with the serving layer reading only the last one (medallion architecture).
- Make each stage idempotent and re-runnable by partition, so a failed day is a re-run and not an incident.
- Name what you'd monitor — freshness, row counts, and schema drift — because unmonitored pipelines are the actual failure mode.
The senior move is volunteering the trade-off you rejected: "500 GB/day is well within Spark's range, but if the requirement were 20 GB/day I'd argue against a cluster entirely and use DuckDB or Polars." Knowing when Spark is overkill is a seniority signal, not disloyalty to the tool.
Reading a physical plan out loud
Being able to narrate an explain() output is the highest-value 30 minutes of PySpark interview prep, because it converts every abstract answer above into something you can demonstrate. Read plans bottom-up: the bottom is the scan, the top is the result.
== Physical Plan ==
AdaptiveSparkPlan isFinalPlan=false
+- SortMergeJoin [user_id#12], [user_id#40], Inner
   :- Sort [user_id#12 ASC NULLS FIRST], false, 0
   :  +- Exchange hashpartitioning(user_id#12, 200)
   :     +- Filter (isnotnull(user_id#12) AND (country#15 = IN))
   :        +- FileScan parquet [user_id#12,country#15,amount#18]
   :              PushedFilters: [IsNotNull(user_id), EqualTo(country,IN)]
   +- Sort [user_id#40 ASC NULLS FIRST], false, 0
      +- Exchange hashpartitioning(user_id#40, 200)
         +- FileScan parquet [user_id#40,plan_tier#44]
What to say about it, in this order:
FileScan parquetwithPushedFilters— the country filter reached the scan, so Parquet row groups are skipped at read time. Predicate pushdown is working, and only three of the table's columns are read.- Two
Exchangenodes — this is the shuffle, and there are two of them because both sides are being repartitioned by the join key. This is the expensive part of the plan. SortMergeJoin— Spark did not broadcast. Either the right side is genuinely large, or it has no statistics and the estimate exceeded the threshold. This is the line I'd investigate first.AdaptiveSparkPlan isFinalPlan=false— the plan hasn't run yet, so AQE may still convert this to aBroadcastHashJoinat runtime. To see what actually executed, look at the SQL tab in the Spark UI, notexplain().
That last bullet is a genuine differentiator: explain() shows intent, the Spark UI shows reality. Very few candidates make that distinction, and it's the difference between someone who has read about AQE and someone who has debugged with it.
Six answers that are commonly taught but wrong
These all appear in widely-shared PySpark interview material. Saying them confidently is worse than saying nothing, because an experienced interviewer hears them as a signal about where you learned.
| Commonly taught | Why it's wrong |
|---|---|
| "Enable AQE first" | On by default since Spark 3.2 — this dates you by two major versions |
"Use coalesce(1) to write one file" |
Collapses the upstream stage to one core; use repartition(1) |
| "Fix OOM by raising executor memory" | Container kills need memoryOverhead; shuffle OOM needs more partitions |
| "Cache anything you reuse" | Only pays off for >1 action, and competes with shuffle for memory |
"repartition() fixes skew" |
Rehashes the same skewed key to the same partition; you need salting, broadcast, or AQE skew join |
| "Spark is faster than pandas" | Not below a few GB, where Spark's coordination overhead dominates — DuckDB and Polars win |
The Spark 4.x facts interviewers now probe
Most PySpark interview content still describes a Spark 3.x world. A short, accurate summary of the 4.x line is disproportionately impressive because so few candidates have one.
| Version | What you should be able to name |
|---|---|
| Spark 3.2 | AQE enabled by default (spark.sql.adaptive.enabled=true) |
| Spark 4.0 | ANSI SQL mode on by default, VARIANT type for semi-structured data, string collation, Python data source API, Python UDTFs; drops JDK 8/11 and Scala 2.12 |
| Spark 4.1 | Real-Time Mode in Structured Streaming — removes the micro-batch boundary for a restricted set of pipelines |
| Spark 4.2.0 | Current stable line, released 14 July 2026 |
The ANSI-mode default is the one to lead with, because it's the change most likely to have bitten a real team: operations that used to silently return null — divide by zero, integer overflow, an invalid cast — now raise an error. Migrating a large Spark 3 codebase to 4.0 usually means finding the places that were quietly relying on null. If you've done that migration, say so; it's a genuine experience signal.
On streaming, the honest framing is that Real-Time Mode narrows the latency argument against Spark but doesn't erase the design difference, and in open-source Spark 4.1 it's Scala and stateless only. We unpacked exactly what it does and doesn't support in Spark vs Flink.
Mistakes that cost candidates the offer
From both sides of the table, the pattern is consistent — and none of these are knowledge gaps:
- Jumping to a fix without naming evidence. "I'd increase the shuffle partitions" is a guess. "I'd check whether spill is non-zero, then increase shuffle partitions" is engineering.
- Describing a project without numbers. "We built a large pipeline" is unscoreable. "40 GB/day, 90 minutes down to 25, cost from ₹X to ₹Y" is a hire signal.
- Never saying "I don't know." Interviewers deliberately go one level past your depth. The correct answer at the edge is "I haven't hit that — here's how I'd find out."
- Answering the definition and stopping. Every definitional question has a "when would you not" follow-up. Volunteer it.
- Claiming tools you used once. If Airflow appears on your CV, expect to be asked how you backfilled a month of a broken DAG.
The most reliable preparation is not more questions. It is being able to narrate two of your own projects in depth for ten minutes each — architecture, volumes, what broke, what you measured, what you changed, what you'd do differently. Every scenario question above can be answered from a real project if you've rehearsed it.
Where SolutionGigs fits
We publish the Learn Data Engineering course and a deep library of Spark internals write-ups — skew, OOM, small files, joins, AQE, partitioning, streaming — because these are the topics that come up in both production incidents and interviews, and the two are the same skill. Every scenario in this guide links to the article that goes three levels deeper. Browse the data engineering library →
Frequently Asked Questions
What are the most commonly asked PySpark interview questions?
The most frequently asked are: the difference between RDD, DataFrame and Dataset; repartition() versus coalesce(); cache() versus persist(); narrow versus wide transformations; what a shuffle is and why it's expensive; how Spark chooses a join strategy; why Python UDFs are slow; and how you'd debug a job that suddenly got slower. The last one carries the most weight, because it's the only one that can't be answered from memory.
How do I prepare for a PySpark interview in 30 days?
Week one: execution fundamentals — jobs, stages, tasks, shuffles, lazy evaluation. Week two: read physical plans with explain() on your own queries until Exchange, BroadcastHashJoin and SortMergeJoin are instantly recognisable. Week three: the four failure modes — skew, out-of-memory, small files, spill. Week four: rehearse two of your own projects out loud with real numbers for volume, runtime, cost, and what you changed.
Is PySpark still in demand in 2026?
Yes. PySpark remains the default distributed processing engine for batch and lakehouse workloads and appears in more data engineering job descriptions than any other processing framework. What's changed is the bar: single-node tools like DuckDB and Polars now handle the small and medium workloads Spark used to absorb, so interviewers test whether you know when Spark is the wrong choice, not just how to use it.
What is the difference between repartition and coalesce in PySpark?
repartition() performs a full shuffle, can increase or decrease the partition count, and produces evenly sized partitions. coalesce() avoids a shuffle by merging existing partitions, can only decrease, and may leave partitions uneven. The trap: coalesce() also reduces upstream parallelism, so coalesce(1) forces the producing stage onto a single core. Use repartition(1) to write one file.
How do you explain data skew in a PySpark interview?
Say that skew means one partition holds far more rows than the others, so one task runs long after the rest finish and stage duration becomes that task's duration. Then name your evidence — a max task duration far above the median in the Spark UI stage summary — and the fixes in order: confirm the hot key, let AQE's skew join handle it, filter sentinel keys like null, broadcast the small side, and salt the key only as a last resort.
Do PySpark interviews include coding rounds?
Usually, but rarely algorithm puzzles. Expect to write DataFrame transformations — group-bys, joins, window functions and deduplication — and to explain the shuffle cost of what you wrote. Window functions are the most common coding topic because they test SQL reasoning and partitioning awareness together. Many companies also run a SQL round graded harder than the PySpark round.
What Spark version should I reference in a 2026 interview?
Reference the Spark 4.x line. Spark 4.0 turned ANSI SQL mode on by default, added the VARIANT type and string collation, and dropped JDK 8/11 and Scala 2.12. Spark 4.1 added Real-Time Mode to Structured Streaming, and Spark 4.2.0 shipped on 14 July 2026. Describing AQE as a new Spark 3.0 feature you have to switch on is two major versions out of date.
Conclusion
The uncomfortable truth about PySpark interviews is that the definitional questions everyone prepares for are the ones that matter least. They're a filter. The offer is decided in the twenty minutes where someone describes a broken job and watches how you think — whether you reach for a config or reach for the evidence.
So prepare in that order. Know the definitions cold, because you can't skip the filter. Then spend the bulk of your time on the three things that are hard to fake: reading a physical plan, naming the diagnostic sequence for skew, OOM, small files and spill, and narrating your own projects with real numbers. Add an accurate sentence about the Spark 4.x line and you'll be more current than most of the people interviewing you.
If you're working through this, the Spark internals series on solutiongigs.in is built to be read in exactly this order — start with what data engineering actually involves, then work through the performance cluster linked throughout this guide. Everything is free, no signup. Start with the Learn Data Engineering course →

Mohammed Yaseen
Founder, SolutionGigs
Mohammed builds and operates production Spark, Kafka and Iceberg pipelines, and has been on both sides of the data engineering interview table. He writes the Spark internals series on solutiongigs.in. LinkedIn →
More in Data Engineering
Spark vs Flink: Which Stream Processing Engine to Choose
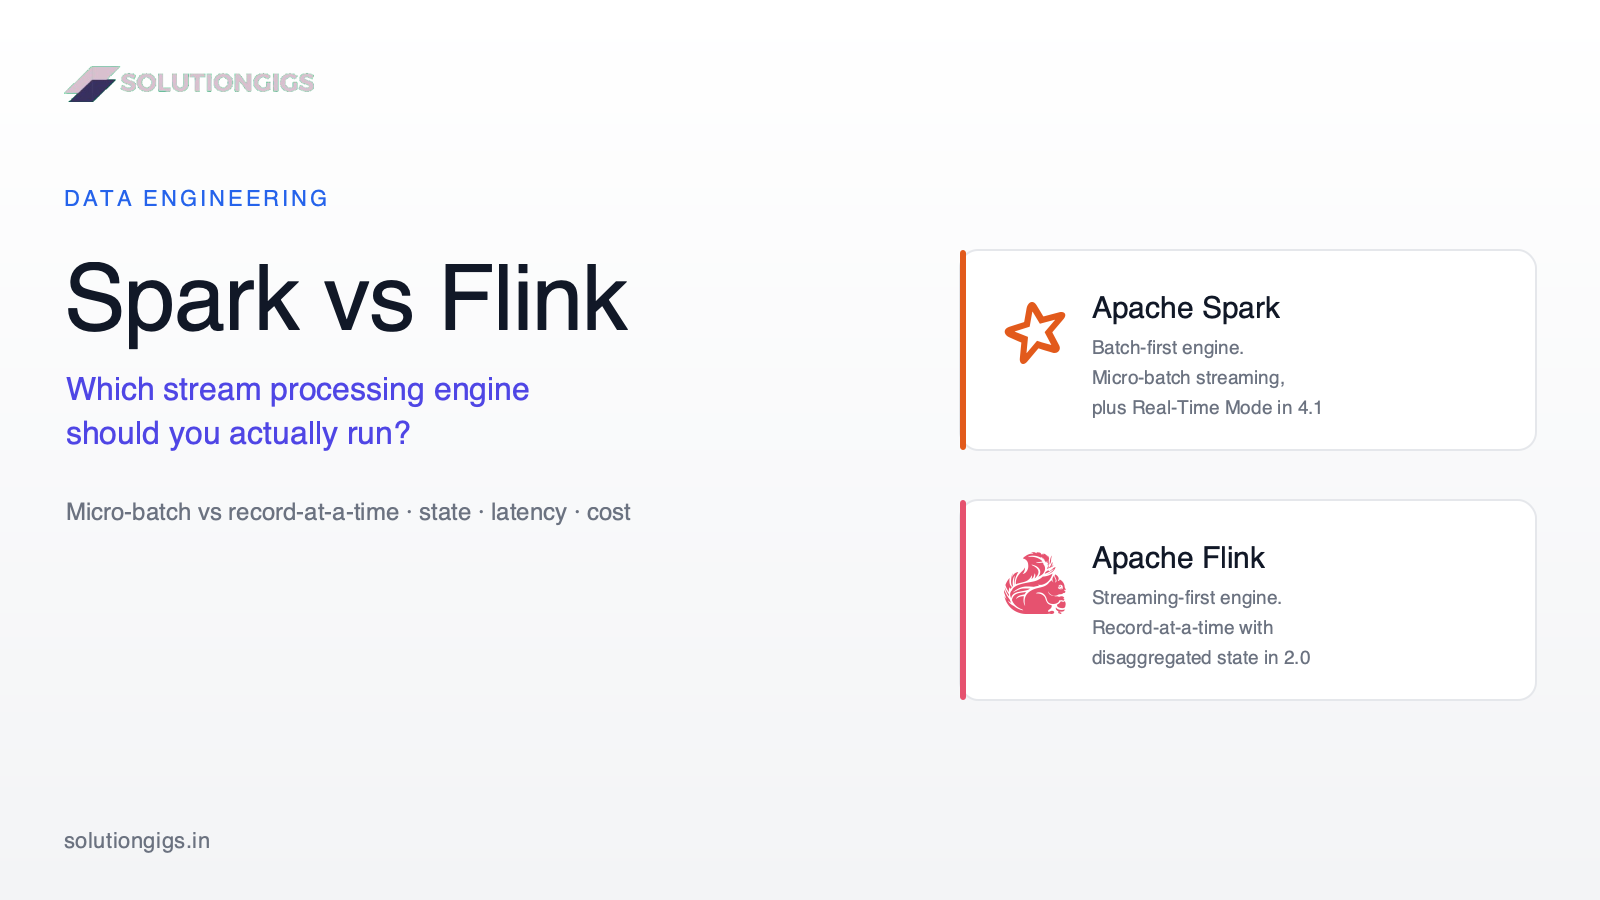
Every Spark vs Flink comparison online rests on the same claim — Spark micro-batches, Flink truly streams, so pick Flink for low latency. That claim expired: Spark 4.1 shipped Real-Time Mode with millisecond-range p99 latency, and Flink 2.0 moved state to object storage. This guide gives you the one architectural idea behind both engines, an original diagram of how a record travels through three execution models, the differences that did not converge (state, timers, recovery blast radius, backpressure), a latency ladder to test whether you need per-event processing at all, and the honest cost of running two engines — including why we chose not to adopt Flink.
Normalization vs Denormalization: When to Break the Rules
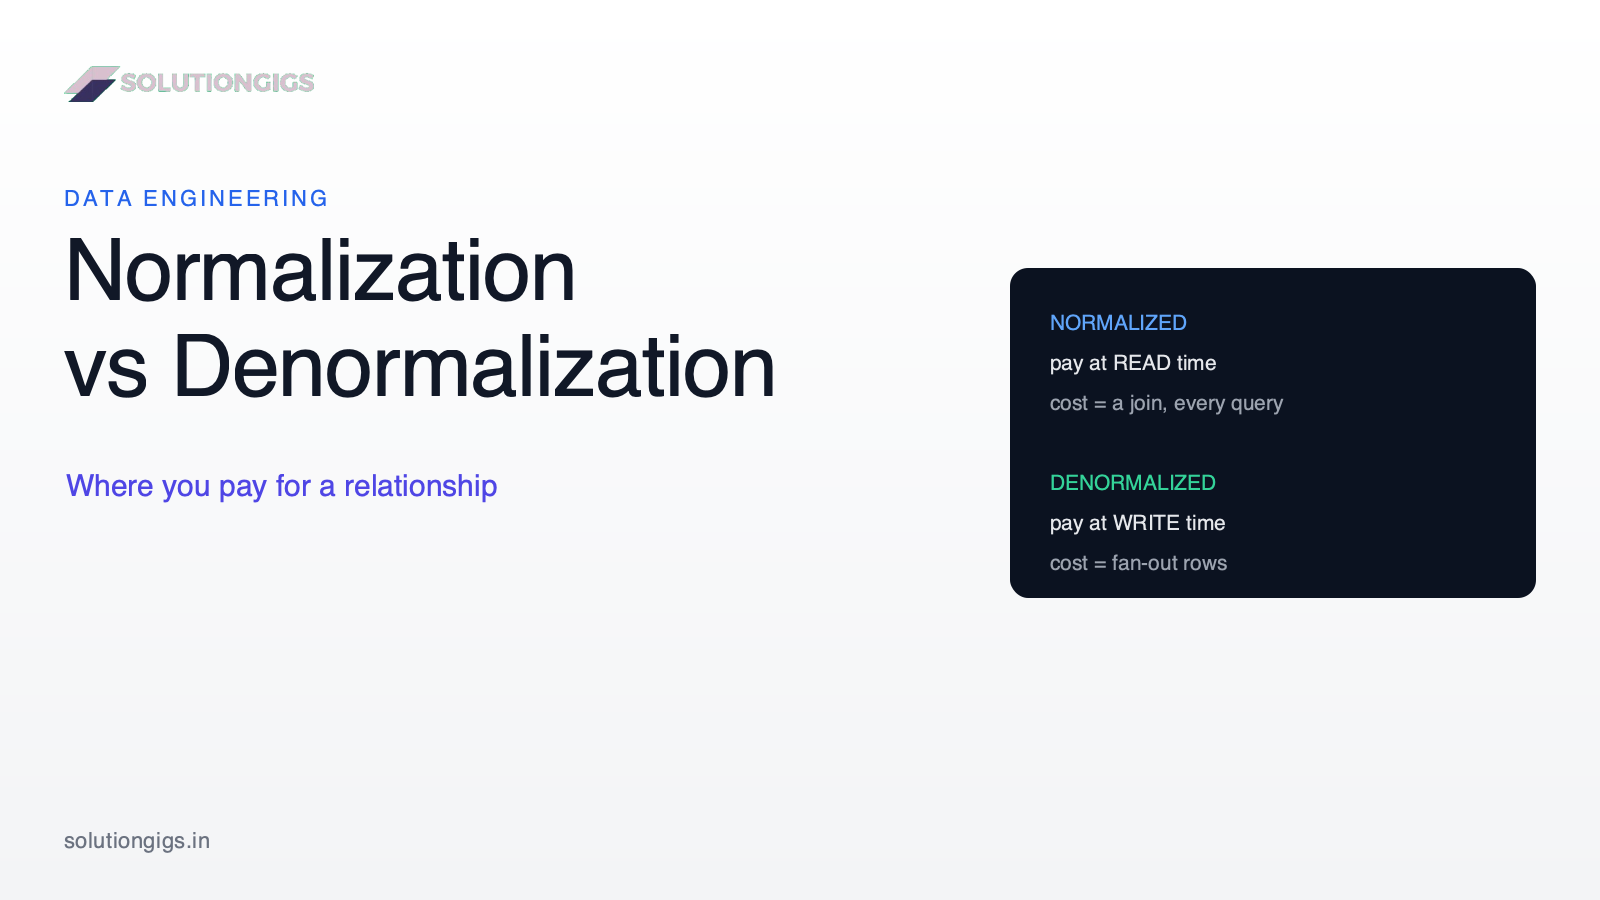
Normalization vs denormalization isn't a debate about table counts — it's a decision about where you pay for a relationship. Normalized schemas pay on every read (a join); denormalized schemas pay on every write, and the bill is the fan-out: how many rows must be rewritten when one source value changes. This guide gives the cost model, the normal forms and the three anomalies on a real table, the five denormalization patterns with the maintenance cost of each, why columnar engines changed the classic advice, the escalation ladder to climb before duplicating anything, and the one rule that has saved us the most pain: denormalize the key, join the label.
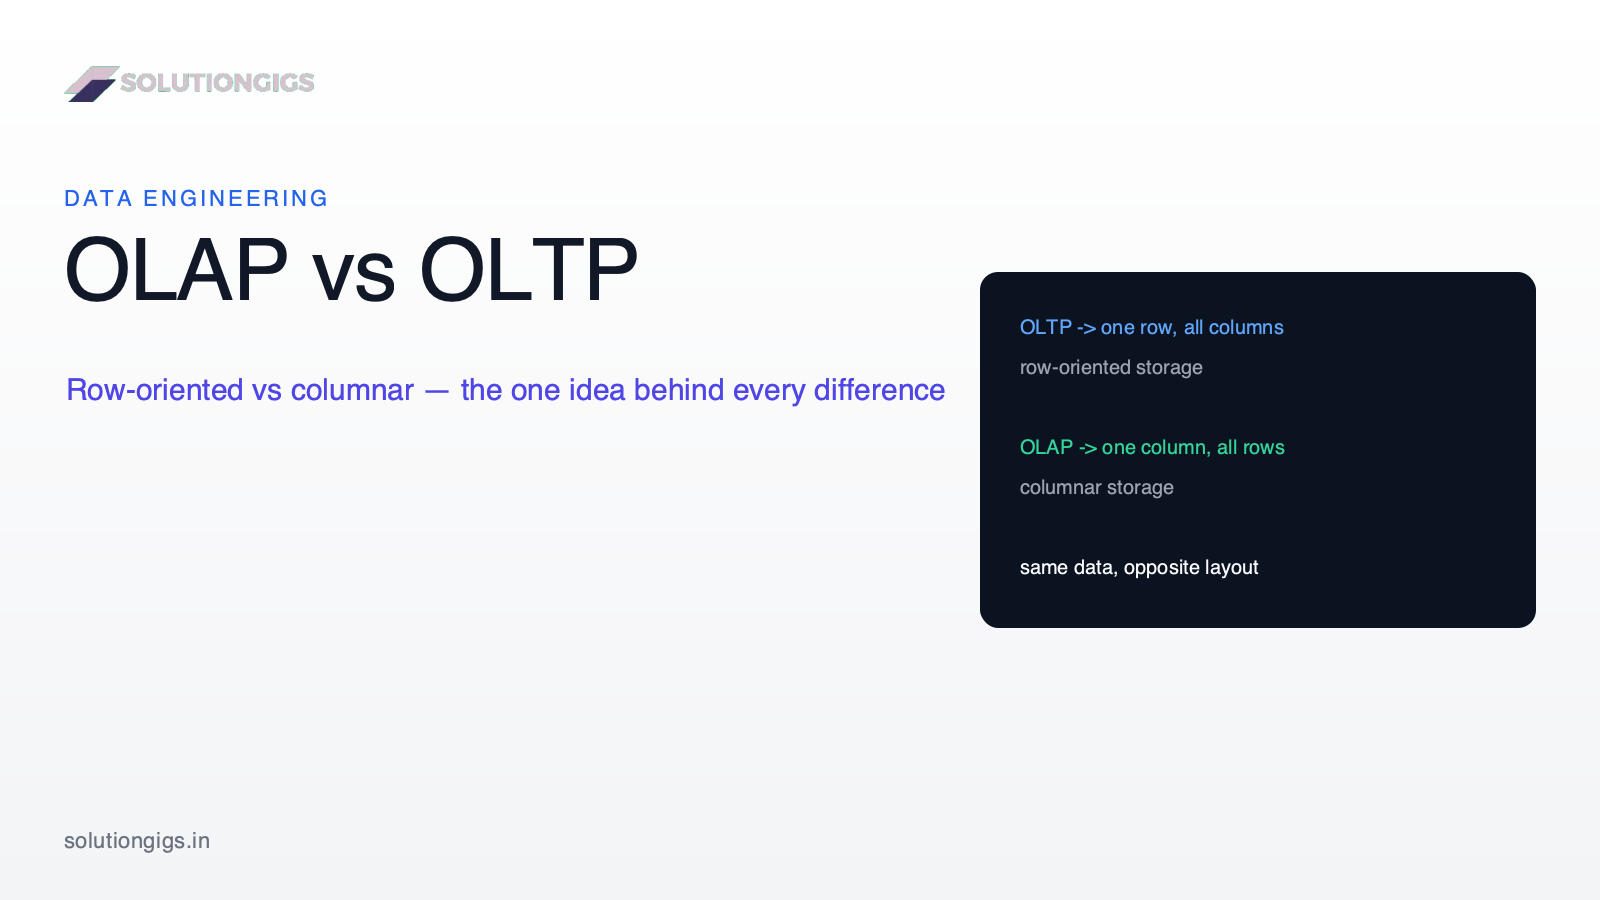
OLAP vs OLTP: The Real Difference Every Engineer Should Know
Most OLAP vs OLTP explainers hand you a twelve-row table and stop — which is no help when a dashboard query brings your production database to its knees. This guide starts with the one physical fact that generates the entire comparison: OLTP stores data row by row, OLAP stores it column by column. From there you get the full side-by-side, an original storage-layout diagram, an honest escalation ladder for moving analytics off your transactional database (including why a read replica is the most common wrong fix), and where lakehouses, DuckDB and HTAP actually fit.