
Spark Executor Tuning: How to Size Cores, Memory, and Executor Count
Last Updated: July 2026 | 15 min read
Quick Answer: For Spark executor tuning, start with 5 cores per executor (HDFS throughput peaks around 5 concurrent tasks), then size memory and count from the hardware: reserve 1 core and 1 GB per node for the OS and cluster manager, divide the remaining cores by 5 to get executors per node, and split each node's remaining RAM across them — minus ~10% for memoryOverhead. Avoid the two extremes: thin executors (1 core) waste overhead, and fat executors (all cores in one JVM) choke on I/O and garbage collection. The balanced middle wins.
Ask three data engineers how to size a Spark cluster and you'll get three answers — and usually a job that either crawls or dies with "Container killed by YARN for exceeding memory limits." Spark executor tuning is one of the highest-leverage skills in data engineering: the same hardware can run your job 5× faster or 5× cheaper depending on how you split it into executors, cores, and memory.
This guide gives you the mental model and the actual math. You'll learn what an executor is, how many cores and how much memory each should get, how to calculate the executor count for any cluster, why the "5-core rule" exists, and how memoryOverhead and dynamic allocation fit in — with a fully worked example you can copy.
What an executor is (and the three knobs you tune)
A Spark executor is a single JVM process on a worker node that runs your tasks and holds data in memory; tuning Spark is mostly deciding how many executors to launch and how many cores and how much memory to give each one. Get that split right and everything downstream — parallelism, shuffle, caching — falls into place.
Three parameters control it:
| Parameter | Flag / config | What it controls |
|---|---|---|
| Executor count | --num-executors (or dynamic allocation) |
How many JVM processes run in parallel across the cluster |
| Cores per executor | --executor-cores |
How many tasks each executor runs at once |
| Memory per executor | --executor-memory (+ spark.executor.memoryOverhead) |
Heap for each executor, plus off-heap overhead |
Total parallelism is simply num-executors × executor-cores — that's how many tasks run at the same instant. Total cluster memory in play is num-executors × executor-memory. The art is choosing values that use the hardware fully without starving any single executor.
How many cores per executor? The 5-core rule
Set executor cores to about 5. HDFS and shuffle client throughput peak at roughly five concurrent tasks per executor, so beyond that, extra cores contend for the same I/O and give diminishing returns — while too few cores waste memory on overhead. This is the single most repeated number in Spark tuning, and it holds up in practice.
Cores per executor is really a choice between two failure modes:
- Thin executors (1–2 cores). You launch many small JVMs. Each carries fixed overhead (heap reserved memory, the broadcast copy, GC threads), so you waste RAM, and a broadcast variable is copied into every executor. More executors also means more shuffle connections.
- Fat executors (all cores, e.g. 16). One giant JVM per node. HDFS write throughput plateaus past ~5 parallel tasks, so the extra cores sit idle on I/O, and garbage collection on a huge heap causes long stop-the-world pauses.
Five cores is the balance: enough parallelism to keep the executor busy, few enough that I/O and GC stay healthy, and it amortizes per-executor overhead across several tasks. Use 4 if your workload is memory-heavy, up to 5 for I/O-bound jobs — but rarely more.
How much memory per executor?
Executor memory is whatever RAM is left on a node after reserving system memory, divided by the number of executors that fit on it, minus the off-heap overhead. You don't pick it in isolation — it falls out of the core math.
Once you know executors-per-node, memory follows:
executor_memory = (node_ram - reserved_ram) / executors_per_node - memoryOverhead
Two rules keep you out of trouble:
- Leave headroom for overhead.
spark.executor.memoryOverhead(off-heap) defaults tomax(384 MB, 10% of executor memory)in Spark 3. The container YARN/Kubernetes grants isexecutor-memory + overhead, and it kills anything that exceeds that total. - Don't go far above ~32 GB heap. Past ~32 GB the JVM drops compressed ordinary object pointers (compressed oops), so every object reference gets bigger and GC pauses grow. Prefer more mid-sized executors over a few huge ones.
The executor memory model
Inside that heap, Spark divides memory into regions — worth knowing when you hit OOM:
| Region | Default share | Holds |
|---|---|---|
| Reserved | 300 MB | Spark internals |
| Unified (execution + storage) | 60% of (heap − 300 MB) via spark.memory.fraction |
Shuffle/join/sort buffers and cached data, sharing one pool |
| User memory | 40% | Your data structures, UDF state |
| Overhead (off-heap) | max(384 MB, 10%) |
Shuffle transfer, Netty, Python/Arrow |
Execution and storage share the unified region and borrow from each other, which is why a heavy shuffle can evict cached data. If your errors are heap-related rather than sizing-related, our guide to Spark out-of-memory errors walks through the exact fixes.
How to calculate executor count: a worked example
To size a cluster, reserve system resources first, divide the rest by your per-executor cores, then subtract one executor for the driver. Here's the canonical calculation on a real cluster.
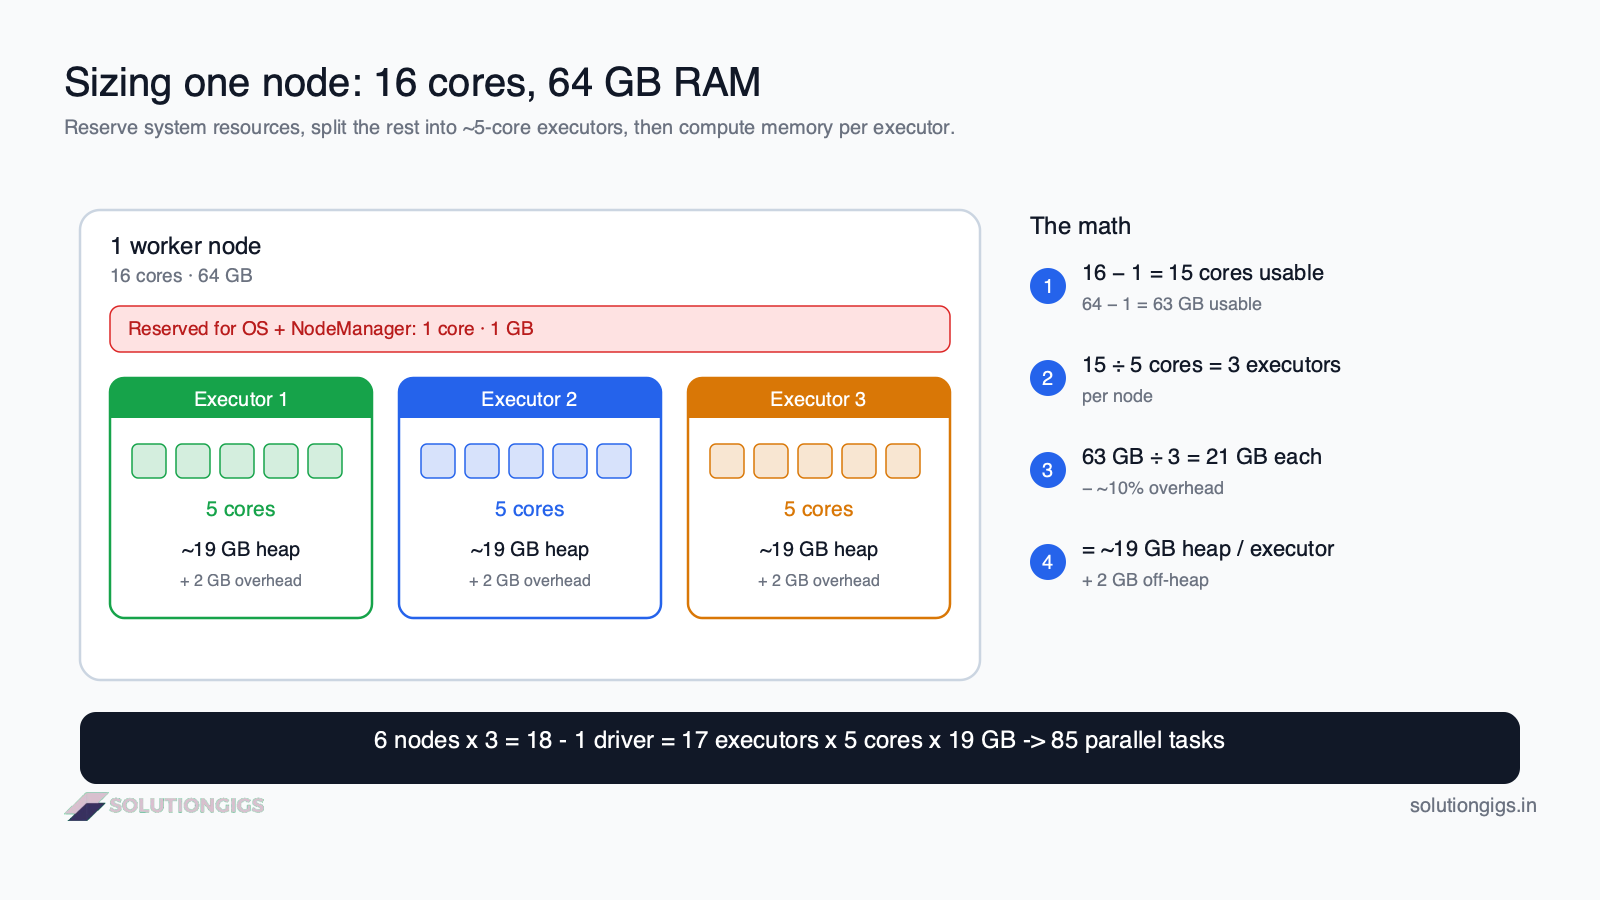
Cluster: 6 worker nodes, each with 16 cores and 64 GB RAM.
Step 1 — Reserve system resources. Every node needs 1 core and 1 GB for the OS, the cluster-manager daemon (YARN NodeManager), and monitoring. → Usable per node: 15 cores, 63 GB.
Step 2 — Cores per executor = 5. Executors per node = 15 ÷ 5 = 3.
Step 3 — Total executors. 3 per node × 6 nodes = 18. Subtract 1 for the driver / ApplicationMaster → 17 executors.
Step 4 — Memory per executor. 63 GB ÷ 3 executors = 21 GB. Subtract ~10% overhead (~2 GB) → ~19 GB executor heap.
Final config:
spark-submit \
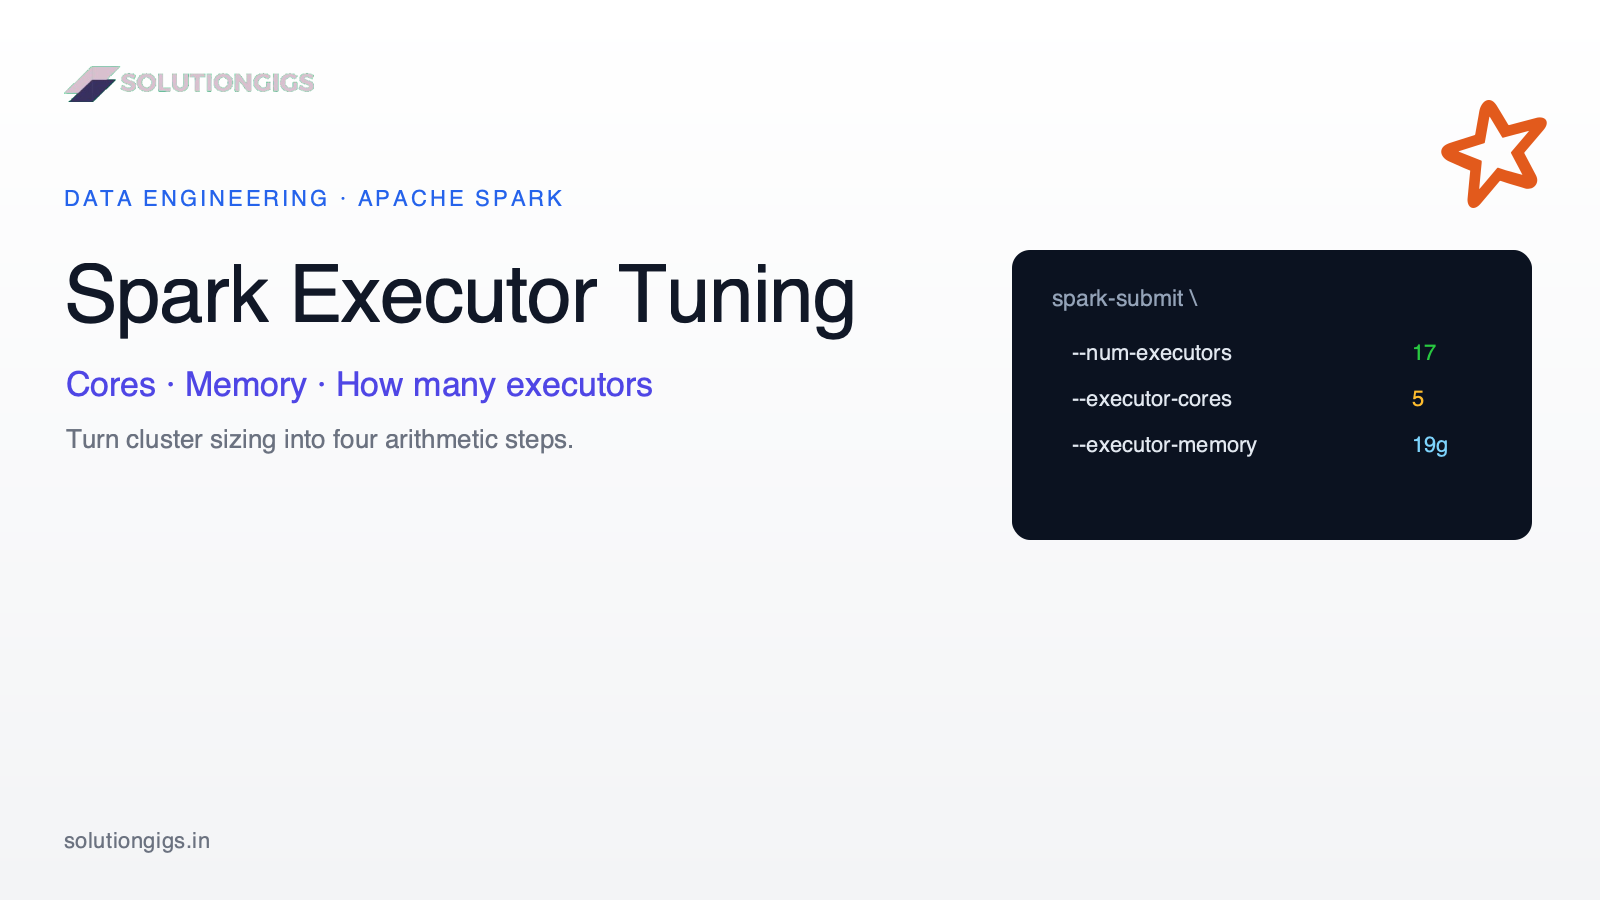
  --num-executors 17 \
  --executor-cores 5 \
  --executor-memory 19g \
  --conf spark.executor.memoryOverhead=2g \
  your_job.py
That's 85 parallel tasks (17 × 5) across the cluster — full utilization without starving any executor or triggering GC storms. Every Spark sizing decision is a variation on these four steps.
At SolutionGigs, we've inherited more than one "give it more memory" cluster where every node ran a single 60 GB fat executor and jobs still crawled. Re-splitting the same nodes into three 19 GB executors — same total RAM — cut runtimes by more than half, purely from parallelism and healthier GC.
Cores, partitions, and parallelism
Your executor cores set how many tasks run at once, so your data should have at least 2–4 partitions per core to keep every core fed. Sizing executors without sizing partitions leaves cores idle.
With 85 total cores, aim for roughly 170–340 partitions of active work. Two levers control this:
spark.sql.shuffle.partitions(default 200) — partitions after a shuffle/join/aggregation. Raise it for large data on big clusters; lower it for small data to avoid tiny tasks.- Input partitioning — how the source data is split on read. See data partitioning strategies and the repartition vs coalesce trade-off for reshaping it.
Too few partitions and cores sit idle (and each task risks OOM from too much data); too many and scheduling overhead dominates. Adaptive Query Execution (on by default in Spark 3.2+) auto-coalesces shuffle partitions, which smooths this out considerably.
Static vs dynamic allocation
Static allocation pins a fixed number of executors for the whole job; dynamic allocation scales executors up and down based on the pending-task backlog. Choose by workload, not by default.
- Dynamic allocation (
spark.dynamicAllocation.enabled=true, needs an external shuffle service) suits shared clusters and bursty or interactive work — idle stages release executors back to the pool, and busy stages request more. It's the right default on multi-tenant platforms like EMR or Dataproc. - Static allocation (
--num-executors N) suits a single dedicated job with a predictable shape — you get consistent, controllable performance with no ramp-up lag.
Even with dynamic allocation, you still tune --executor-cores and --executor-memory; you're only letting Spark decide how many of those executors to run.
Common Spark executor tuning mistakes
- One fat executor per node. All 16 cores in a single JVM looks efficient but throttles on HDFS throughput and GC. Split into ~5-core executors.
- Forgetting
memoryOverhead. The classic "Container killed for exceeding memory limits" is almost always off-heap overhead (shuffle, Python) blowing the container limit — raise overhead, not heap. PySpark and pandas UDFs need extra overhead because they run outside the JVM. - Heaps above ~32 GB. You lose compressed oops and inherit long GC pauses. More mid-sized executors beat fewer giant ones.
- Not reserving system resources. Claiming all 16 cores and 64 GB starves the OS and NodeManager, causing lost executors and container failures.
- Sizing executors but ignoring partitions. 85 cores with 50 partitions means 35 idle cores. Match partition count to total cores (see data skew when partitions are uneven).
- Broadcasting without accounting for memory. A broadcast join copies the small table into every executor's heap — cheap per executor, but multiplied across many thin executors it adds up.
Your Spark sizing cheat sheet
- Cores/executor: start at 5 (4 if memory-bound).
- Reserve 1 core + 1 GB per node for OS + cluster manager.
- Executors/node = (cores/node − 1) ÷ cores-per-executor.
- Total executors = executors/node × nodes − 1 (driver).
- Memory/executor = (RAM/node − 1 GB) ÷ executors/node − 10% overhead.
- Cap heap near 32 GB; prefer more executors over bigger ones.
- Partitions: 2–4 per core; tune
spark.sql.shuffle.partitions. - Verify in the Spark UI — check task time, GC time, and spill, then adjust.
Sizing is a starting point, not a final answer: profile the real job in the Spark UI (Executors and Stages tabs), watch GC and spill, and iterate. If you're still learning the DataFrame API those tasks run, our free interactive Spark with Scala course and the PySpark fundamentals guide are a good place to start.
Frequently Asked Questions
How many cores should a Spark executor have?
Five cores per executor is the widely used sweet spot. Beyond about five concurrent tasks, executors stop gaining throughput because HDFS and shuffle I/O become the bottleneck, and garbage collection on a large heap worsens. Fewer than three cores wastes memory on per-executor overhead and blocks shared broadcasts. Start at 4–5 cores and adjust from the Spark UI.
How much memory should I give a Spark executor?
Divide each node's usable RAM by the number of executors that fit on it, then subtract about 10% overhead. For a node with 63 GB usable and 3 executors, that's 21 GB minus overhead ≈ 19 GB of heap. Avoid heaps far above 32 GB, where the JVM loses compressed pointers and GC pauses grow — run more mid-sized executors instead of a few giant ones.
How do I calculate the number of executors in Spark?
Reserve 1 core and 1 GB per node for the OS and cluster manager, divide the remaining cores by cores-per-executor to get executors per node, multiply by the node count, and subtract one for the driver. Example: 6 nodes × 16 cores, minus 1 reserved = 15 cores; at 5 cores each that's 3 per node × 6 = 18, minus 1 = 17 executors.
What is spark.executor.memoryOverhead?
It's off-heap memory per executor for things outside the JVM heap — shuffle buffers, Netty network buffers, and Python/Arrow processes in PySpark. In Spark 3 it defaults to max(384 MB, 10% of executor memory). YARN or Kubernetes kills a container that exceeds heap + overhead, so "Container killed for exceeding memory limits" usually means you need more overhead, not more heap.
What is the difference between fat and thin executors?
A thin executor has very few cores and little memory, so you run many — but per-executor overhead multiplies and broadcasts copy to every one. A fat executor takes all of a node's cores in one JVM — but HDFS throughput plateaus past ~5 tasks and GC on a huge heap stalls. Around 5 cores with a moderate heap beats both extremes.
Should I use dynamic allocation in Spark?
Use it for shared clusters and bursty or interactive workloads — dynamic allocation adds and removes executors based on the pending-task backlog, freeing idle resources for other jobs. Enable spark.dynamicAllocation.enabled=true with an external shuffle service. For a single dedicated job with a predictable size, static allocation with a fixed --num-executors gives more consistent performance.
Why is 5 cores per executor the recommended limit?
HDFS client throughput peaks at roughly five concurrent tasks per executor; beyond that, extra cores contend for the same I/O with diminishing returns. A moderate core count also keeps the heap small enough for healthy garbage collection while amortizing per-executor overhead and sharing broadcast variables. Five cores balances parallelism, I/O throughput, and memory efficiency.
Conclusion
Spark executor tuning isn't guesswork once you have the model: 5 cores per executor, reserve system resources, divide what's left, and leave 10% for overhead. That single recipe turns a vague "how big should my cluster be?" into four arithmetic steps that produce a config you can defend. The two mistakes to avoid are equally simple — don't cram every core into one fat executor, and don't forget the off-heap overhead that quietly kills containers.
Then measure. The Spark UI's Executors and Stages tabs tell you whether cores are idle, GC is eating time, or tasks are spilling — and each of those points to a specific knob. Size, run, read the UI, adjust. Do that a few times and cluster sizing stops being folklore and becomes a repeatable calculation.
Want to go deeper on Spark and the modern data stack? Explore the free, hands-on Spark with Scala course and the rest of the SolutionGigs blog. Building or scaling a data platform and want expert help? SolutionGigs connects you with vetted data engineers — it's free to post your project.

Mohammed Yaseen
Founder, SolutionGigs
Mohammed builds and tunes large-scale Spark pipelines on Kafka, EMR, and the lakehouse — and has resized more "just give it more memory" clusters than he can count. LinkedIn →