
OLAP vs OLTP: The Real Difference, Explained by a Data Engineer
Last Updated: August 2026 | 12 min read
Quick Answer: OLTP (Online Transaction Processing) systems handle many small, fast operations that touch a few rows each — placing an order, updating a profile. OLAP (Online Analytical Processing) systems handle fewer, much larger queries that scan and aggregate millions of rows. The real difference isn't the acronym, it's physical: OLTP databases store data row by row, so one record sits together on disk; OLAP databases store data column by column, so a query reads only the columns it needs. Every other difference — normalized vs star schema, milliseconds vs seconds, write-heavy vs read-heavy — is a consequence of that single storage decision.
Most explanations of OLAP vs OLTP hand you a twelve-row comparison table and stop. You memorize it for an interview, and then a dashboard query brings your production database to its knees and the table doesn't help you at all.
This guide takes the other path. We'll start with the one physical fact that generates the entire comparison table, then use it to answer the question people are actually searching for: my analytics are killing my transactional database — what do I do about it? You'll get the full comparison, the storage-layout diagram that explains it, an honest escalation ladder (including why read replicas are the most common wrong answer), and where lakehouses and HTAP fit in 2026.
The one idea: row-oriented vs columnar storage
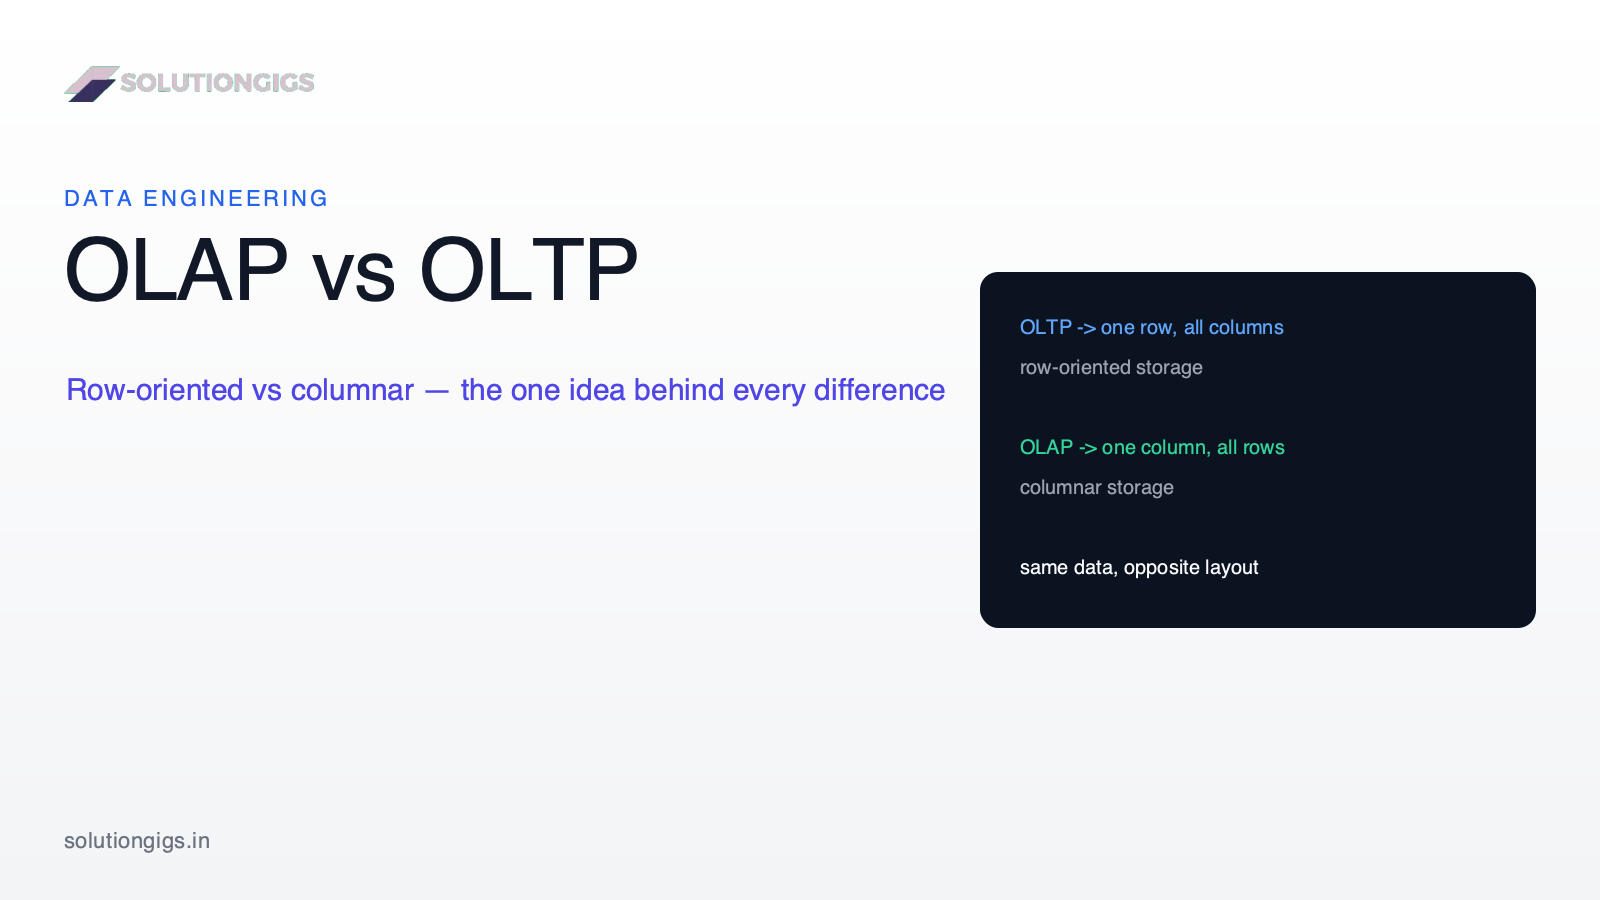
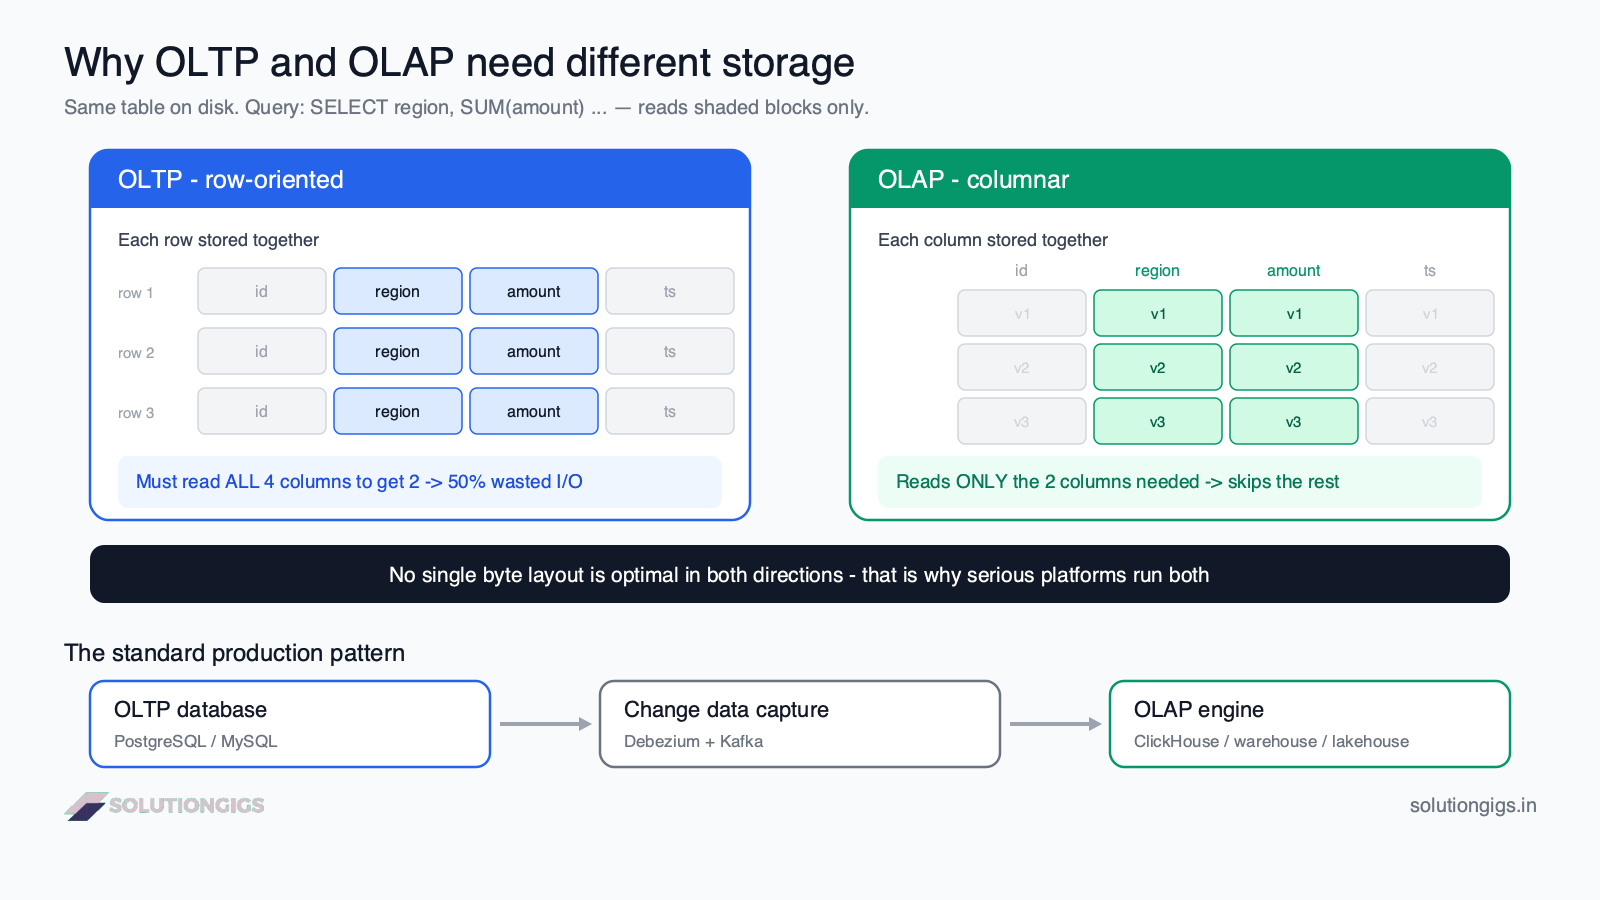
OLTP and OLAP differ because they lay bytes on disk in opposite directions — OLTP stores a row's fields together, OLAP stores a column's values together.
Picture an orders table with 50 columns and 100 million rows.
An OLTP query says: "give me order #84213." You want one row, all 50 columns. A row-oriented database stores that row's 50 fields contiguously, so it seeks once with a B-tree index and reads a single block. Perfect.
An OLAP query says: "total revenue by region for last quarter." You want two columns, 100 million rows. On that same row store, the database must read every row off disk in full — all 50 columns — then throw away the 48 it didn't ask for. You've read roughly 25× more data than the query needed.
A columnar database stores all 100 million amount values together, and all 100 million region values together. It reads two tight, uniform streams and ignores the rest of the table entirely. Same query, a fraction of the I/O — and because each column holds one data type, it compresses far better and can be scanned with vectorized CPU instructions.
That's the whole thing. Row layout optimizes "all columns of one row." Columnar layout optimizes "one column of all rows." Hold onto it, because every row of the table below falls out of it.
OLAP vs OLTP: full comparison
Here's the complete side-by-side. Note how each row traces back to the storage decision above.
| Dimension | OLTP | OLAP |
|---|---|---|
| Purpose | Run the business | Analyze the business |
| Full name | Online Transaction Processing | Online Analytical Processing |
| Storage layout | Row-oriented | Columnar |
| Typical query | Read/write a few rows by key | Scan + aggregate millions of rows |
| Query volume | Thousands per second | Tens to hundreds per hour |
| Latency target | Sub-millisecond to milliseconds | Seconds to minutes |
| Read/write mix | Balanced, write-heavy | Read-heavy, bulk-loaded |
| Schema design | Normalized (3NF) | Denormalized (star/snowflake, wide tables) |
| Data scope | Current operational state | Historical, aggregated |
| Indexes | Many B-tree indexes for point lookups | Few; zone maps, min/max stats, data skipping |
| Concurrency | High, row-level locks, MVCC | Low, mostly read-only snapshots |
| ACID importance | Critical — money moves | Important, but eventual consistency is often fine |
| Data size | Gigabytes | Terabytes to petabytes |
| Backup/recovery | Must be complete — it's the source of truth | Rebuildable from source systems |
| Primary users | Applications, customers | Analysts, data scientists, executives |
| Examples | PostgreSQL, MySQL, Oracle, SQL Server, DynamoDB | Snowflake, BigQuery, Redshift, ClickHouse, DuckDB, Iceberg/Delta lakehouses |
What is OLTP?
OLTP is a workload of many small, concurrent transactions that read and write a handful of rows each, with strict correctness guarantees.
This is the database behind your application. A customer buys something and the system checks inventory, decrements it, writes an order row, records a payment, and updates a loyalty balance — all as one atomic unit that either fully happens or fully doesn't. Withdrawing from an ATM, booking a seat, updating a profile: all OLTP.
Three design choices define it:
- Row-oriented storage, so an entire record can be written or fetched in one place.
- Normalization, usually to third normal form. Each fact lives in exactly one place, so an update is one cheap write and two copies can never disagree. The cost is joins at read time — acceptable when you're joining a handful of rows.
- ACID transactions and row-level concurrency control, because a lost write here isn't a stale chart, it's missing money.
The OLTP workload is measured in transactions per second and tail latency. A p99 of 200 ms is a production incident.
Use OLTP when your queries are driven by user actions, touch few rows, and must be correct right now.
What is OLAP?
OLAP is a workload of relatively few, large, read-only queries that scan, filter, group, and aggregate huge volumes of historical data to answer business questions.
This is the database behind your dashboards, reports, and models. "Revenue by product category by month for three years." "Which cohort churns fastest?" "P95 latency per device per region across 400 million events." No single row matters; the shape of the whole set matters.
The design choices invert:
- Columnar storage, so a query touching 3 of 60 columns reads 5% of the data instead of 100%. Type-uniform columns also compress hard — 5–10× is routine — which cuts I/O again.
- Denormalization into a star schema or a wide flat table. Redundancy is fine because you write once and read a million times; avoiding joins across billions of rows is worth far more than saving storage.
- Few indexes, heavy statistics. Instead of B-trees pointing at individual rows, OLAP engines keep min/max metadata per block and skip whole chunks of data that can't match the
WHEREclause. This is exactly what Parquet footers and Iceberg manifests do. - Bulk loading, usually through an ETL or ELT pipeline, rather than single-row inserts.
OLAP is measured in scan throughput and query latency on cold data, not transactions per second.
Use OLAP when your queries are driven by questions rather than user actions, touch many rows, and can tolerate being a few minutes behind reality.
The question behind the question: "analytics is killing my production database"
Almost nobody searches "OLAP vs OLTP" out of pure curiosity. They search it because a report is timing out, or the ops team noticed the app got slow every morning at 9 a.m. when the dashboards refresh.
Here's what's happening. Your analytical query is scanning a large fraction of a table on a row store. That does three things to your OLTP workload at once:
- It evicts the buffer cache. The hot pages your transactions depend on get pushed out by a giant sequential scan of cold data, so ordinary queries start hitting disk.
- It monopolizes I/O and CPU. A scan is the greediest possible workload.
- It holds a long transaction open. On PostgreSQL specifically, a long-running read holds back the oldest visible snapshot, which blocks vacuum from cleaning up dead tuples — so bloat grows while the report runs.
That last one is the sneaky one. The report finishes, but the database is left slower than it started.
The escalation ladder (do these in order)
| Step | What you do | Fixes | Doesn't fix | When to stop here |
|---|---|---|---|---|
| 1. Index & rewrite | Add the right index, kill the accidental SELECT *, filter earlier |
Queries that were never truly analytical | Genuine full-table aggregations | The query drops to milliseconds |
| 2. Pre-aggregate | Materialized view or summary table refreshed on a schedule | Repeated dashboard queries over fixed grains | Ad-hoc exploration, new dimensions | Your dashboards are fixed and few |
| 3. Read replica | Point reporting at a streaming replica | Contention — transactions stop competing with reports | Speed — the query is just as slow | Reports are slow but tolerable, and the app is safe |
| 4. Columnar OLAP engine | Replicate into ClickHouse / DuckDB / a warehouse / a lakehouse via CDC | Scan speed — often 10–100× | Adds a pipeline and freshness lag to operate | You need real analytics at scale |
Step 3 is where most teams get stuck, and it deserves a warning.
Why a read replica is the most common wrong fix
A read replica solves contention, not scan efficiency. This is the single most useful thing in this article, and almost no comparison post says it.
Moving the report to a replica genuinely protects your transactions — that's real and worth doing. But the replica runs the same row-oriented storage engine on the same data. A query that scanned 400 GB on the primary scans 400 GB on the replica. If your complaint was "the report takes 90 seconds," you will now have a report that takes 90 seconds on a different machine, plus a second machine to pay for and operate.
There's a second trap. On PostgreSQL, long analytical queries on a streaming replica conflict with replay of incoming changes from the primary. The replica either cancels your query (ERROR: canceling statement due to conflict with recovery) or, if you raise max_standby_streaming_delay, falls behind — so your "real-time" dashboard is now reading stale data anyway. You can trade one for the other, but you can't have both.
The diagnostic question is simple: is the complaint contention or scan time? If transactions slow down when reports run, a replica helps. If the report itself is too slow, only a change of storage model helps.
What we did at SolutionGigs
Our infrastructure-monitoring platform, Telemetrix, ingests device telemetry continuously. Early on we ran both workloads on one PostgreSQL instance — the API wrote events and read device state, and the customer-facing analytics panel queried the same tables.
It worked until it didn't. A 90-day "P95 latency by device group" panel was scanning tens of millions of rows in a wide events table, and every time a customer opened that page, write latency on the ingest path spiked. We did the textbook thing and added a read replica. Write latency recovered immediately — and the panel was still slow. That was the moment the distinction became concrete for us: we had bought isolation, not speed.
The actual fix was to stop asking a row store to do a columnar job. We kept PostgreSQL as the system of record for device state and moved the analytical panel onto columnar storage — telemetry landing as Apache Iceberg tables on object storage, queried by an engine that only reads the columns a panel asks for. The panel query touches 4 columns of a ~60-column event table. On the row store it read all 60. That ratio, not any clever tuning, was the entire performance story.
The honest trade-off: you now run a pipeline, and your analytics are minutes behind your transactions instead of instant. For dashboards that's almost always fine. For anything a user action depends on — a fraud check at checkout, an inventory count — keep it in OLTP where it belongs.
Is my database OLTP or OLAP?
PostgreSQL, MySQL, SQL Server, Oracle, and MongoDB are OLTP systems. Snowflake, BigQuery, Redshift, ClickHouse, DuckDB, and lakehouse engines over Iceberg or Delta Lake are OLAP systems.
A few clarifications the textbook tables get wrong:
- "OLAP" is not a synonym for "data warehouse." OLAP is a workload; a warehouse is one system that serves it. A lakehouse built on Parquet files is every bit as much an OLAP system — Parquet's columnar layout is literally the same physical idea a warehouse uses internally.
- OLAP doesn't require a cluster anymore. DuckDB is a full columnar OLAP engine that runs in-process, like SQLite for analytics. If your analytical data fits on one large machine — which covers a lot of companies — you may not need distributed anything.
- Postgres can be pushed toward OLAP, via columnar extensions and forks, and that's a legitimate option for mid-sized workloads. Just know you're bolting a different storage model onto an OLTP engine, not discovering that Postgres was secretly columnar.
- The old "OLAP cube" — precomputed multidimensional cubes from the 1990s — is largely obsolete. Modern columnar engines are fast enough to aggregate on the fly, so "OLAP" today usually means a columnar query engine, not a cube.
What about HTAP and zero-ETL?
HTAP (Hybrid Transactional/Analytical Processing) systems run both workloads on one platform by maintaining two internal copies of the data — a row store for transactions and a column store for scans — and routing each query to the right one.
That's the honest description, and it tells you both the appeal and the limit. The appeal: one system, no pipeline, no lag. The limit: the trade-off didn't vanish, it just moved inside the product. Someone still pays to keep the columnar copy fresh, and you're now tied to a vendor's opinion about how to do it.
HTAP and "zero-ETL" integrations work well for narrow, bounded workloads — real-time dashboards over recent operational data, operational analytics feeding back into the app. They're a poor fit when your analytics span years of history, join in data from other sources, or feed a full BI layer.
As of 2026, the standard production architecture is still two specialized databases connected by change data capture: an OLTP database serving the application, streaming changes via Debezium and Kafka into a columnar OLAP engine serving analytics. It's the boring answer, and it's boring because it works — each system does the job its storage layout is good at. If you want the full picture of how that pipeline is assembled, see our guide to the modern data stack.
Common mistakes to avoid
- Running dashboards against the production OLTP database. It works at small scale, which is exactly why teams keep doing it until it breaks in front of a customer.
- Buying a read replica and expecting speed. It buys isolation. Know which problem you're solving before you spend the money.
- Normalizing your warehouse. Applying 3NF discipline to analytical tables is a classic move by strong backend engineers, and it produces slow, join-heavy queries. Denormalize on purpose.
- Reaching for a distributed OLAP cluster at 100 GB. DuckDB or a single warehouse instance will beat a badly-run cluster, and cost a fraction. Scale when the data says to.
- Treating OLAP as a place where correctness doesn't matter. Eventual consistency is fine; silently wrong numbers are not. Analytical pipelines need data quality tests precisely because there's no transaction to protect you.
- Copying OLTP schemas straight into the warehouse. Your application's tables are shaped for writes. Model analytical tables for the questions people ask, not for how the app happens to store things.
How SolutionGigs helps
Knowing the definitions is easy; knowing when your workload has outgrown one storage model is the expensive part. At SolutionGigs, we build and run both sides of this line in production — transactional systems that can't drop a write, and columnar analytics platforms that scan billions of rows for dashboards. If your production database is groaning under reporting load, or you're deciding whether you need a warehouse, a lakehouse, or just a better index, we can help you make that call with numbers instead of vibes.
Frequently Asked Questions
What is the main difference between OLAP and OLTP?
OLTP systems run high volumes of small, fast reads and writes touching a few rows each; OLAP systems run fewer, larger queries that scan and aggregate millions of rows. The deepest difference is physical: OLTP stores data row by row so one record sits together, while OLAP stores data column by column so a query reads only the columns it needs. Schema design, latency targets, and concurrency behaviour all follow from that.
Is PostgreSQL OLTP or OLAP?
PostgreSQL is an OLTP database. Its row-oriented storage, B-tree indexes, and MVCC concurrency are built for high-concurrency single-row reads and writes. It can run analytical queries, and columnar extensions push it further, but on large scans it reads entire rows from disk and discards unneeded columns — far slower than a purpose-built columnar engine. MySQL, SQL Server, and Oracle are the same by default.
Why don't read replicas fix slow analytics queries?
A read replica solves contention, not scan efficiency. Moving a report off the primary stops it competing with transactions for CPU and cache, which is a real win — but the query runs on the same row-oriented engine, so it's exactly as slow. On PostgreSQL, long queries on a streaming replica can also be cancelled by replication conflicts or force the replica to lag. A replica buys isolation; only columnar storage buys speed.
Can one database do both OLTP and OLAP?
Partly. HTAP systems handle both by keeping a row store for transactions and a column store for scans internally, routing each query appropriately. They suit narrow workloads where analytics mostly touch recent data. They don't repeal the underlying trade-offs, and the standard 2026 production pattern is still two specialized databases connected by change data capture rather than one system doing both.
Why do OLAP databases use a star schema instead of normalized tables?
OLTP normalizes to eliminate redundancy — when a fact lives in one place, updates are cheap and copies can't disagree. OLAP denormalizes into a star schema because analytical queries rarely update rows, and joins across billions of rows are expensive. Trading storage redundancy for fewer joins is a great deal when you write once and read millions of times, and a bad deal when you write constantly.
Is a data warehouse the same as OLAP?
Not quite. OLAP is a workload — large scans and aggregations — while a data warehouse is one kind of system built to serve it. Snowflake, BigQuery, ClickHouse, and DuckDB are all OLAP engines, and so is a lakehouse built on Apache Iceberg or Delta Lake over Parquet. Parquet's columnar layout is the same physical idea a warehouse uses internally.
How do I move analytics off my transactional database?
Work up the ladder rather than jumping to the end. Add the right index and rewrite the query first. Then pre-aggregate with materialized views if the dashboards are fixed. Then move reporting to a read replica to protect transactions. If it's still slow, that's your signal the storage model is the bottleneck — replicate into a columnar OLAP engine via change data capture and keep the transactional database as the system of record.
Conclusion
OLAP vs OLTP is usually taught as vocabulary, and that's why the comparison table never helps when things break. It's really one engineering decision — store a row together, or store a column together — and everything else is downstream of it. Normalized versus star schema, milliseconds versus seconds, thousands of transactions per second versus terabyte scans: all of it is that choice, echoing outward.
Once you see it that way, the practical questions answer themselves. Analytics slowing your app is a storage model mismatch, not a tuning problem. A read replica moves the pain without curing it. And the reason nearly every serious data platform runs two databases connected by CDC isn't inertia — it's that no single byte layout can be optimal in both directions at once.
Start where your problem actually is. If transactions are suffering, isolate them. If scans are slow, go columnar. And if you'd rather have engineers who've run both sides in production make that call with you, talk to us at SolutionGigs — it's free to start.

Mohammed Yaseen
Founder, SolutionGigs
Mohammed builds and runs production systems on both sides of the OLTP/OLAP line — transactional services that can't drop a write, and columnar analytics platforms scanning billions of rows. He writes about the architecture decisions that actually move the needle for data teams. LinkedIn →