
Dimensional Modeling & Star Schema Explained
Dimensional modeling and the star schema explained — fact vs dimension tables, grain, keys, star vs snowflake, and a step-by-step design method with SQL examples.

📚 Lesson in the Data Modeling & Warehousing track of our free Learn Data Engineering course. Uses SQL joins and aggregations you've already learned.
Quick Answer: Dimensional modeling is a data warehouse design technique that splits data into fact tables (measurable events, like sales) and dimension tables (descriptive context, like product, customer, date). The most common form is the star schema: one central fact table surrounded by dimension tables, joined by keys. This shape is deliberately denormalized so analytical queries stay simple and fast — you aggregate the facts and filter or group by the dimensions.
You've learned to query and join data. Now the question is how the tables should be shaped in the first place. Dimensional modeling, pioneered by Ralph Kimball, is the answer that has powered data warehouses for decades and is still the default in 2026 — even inside modern lakehouses. This lesson teaches you facts vs dimensions, grain, the star schema, star vs snowflake, and a repeatable method to design one yourself.
What is dimensional modeling?
Dimensional modeling organizes data for analysis — into facts (what happened) and dimensions (the context around it). Transactional databases are normalized to make writes safe and non-redundant. Analytical databases have the opposite priority: make reads fast and queries intuitive. Dimensional modeling is how you get there. (That inversion is the heart of OLAP vs OLTP, if you want the underlying storage reasons.)
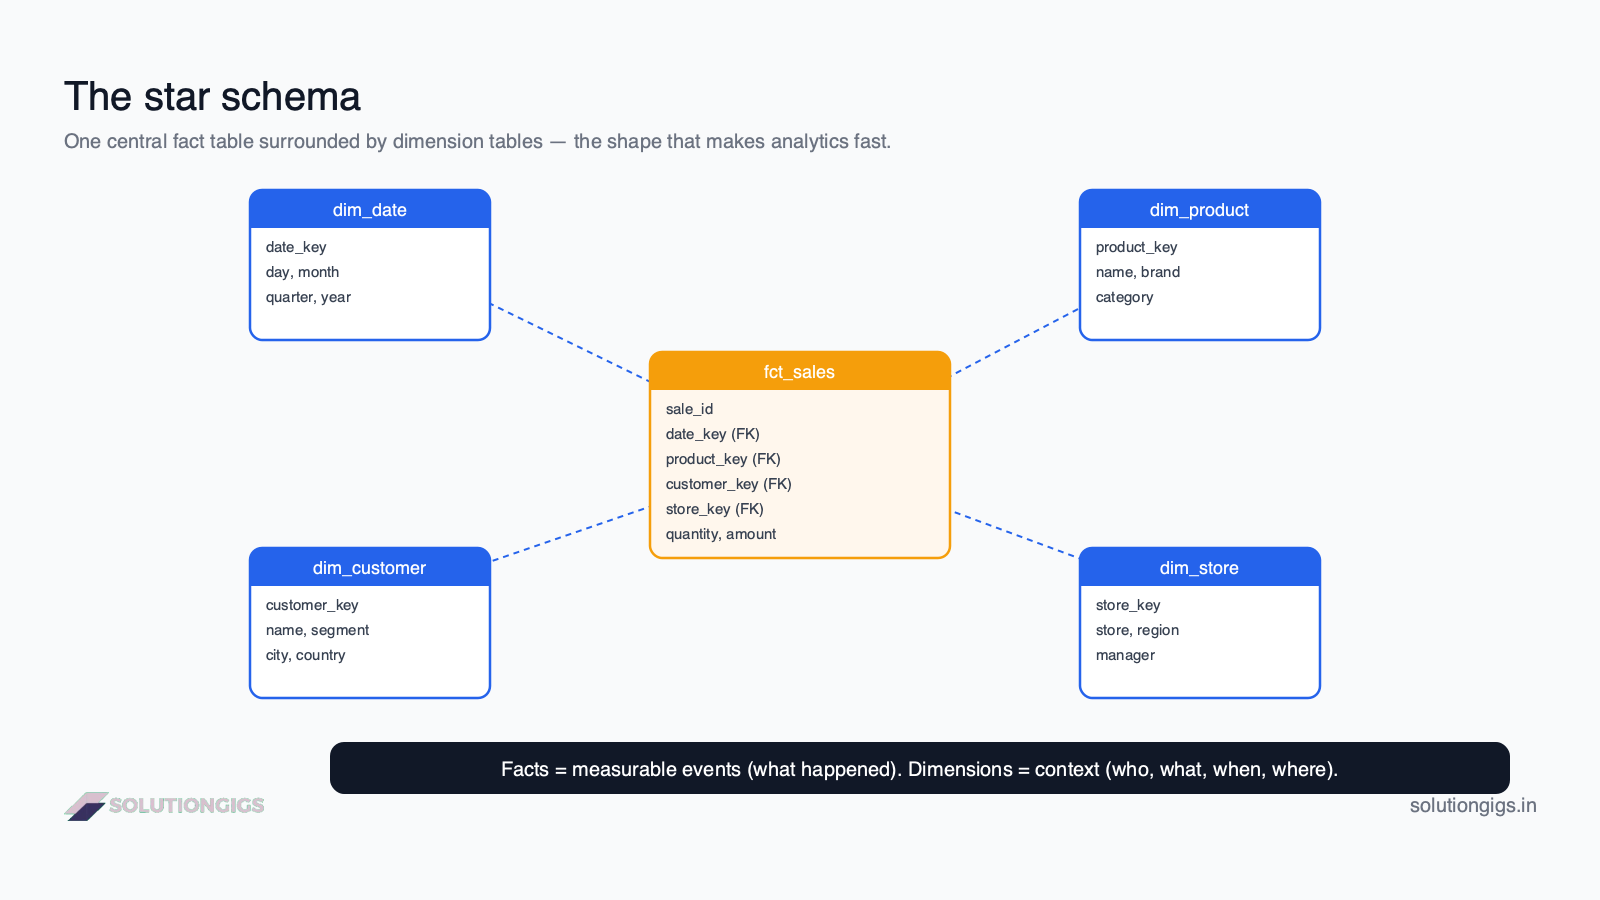
The model has two building blocks:
- Fact tables — the measurable events of the business. Each row is something that happened, with numeric measures (quantity, amount) and foreign keys pointing to dimensions.
- Dimension tables — the descriptive context that gives facts meaning: who, what, when, where. Products, customers, dates, stores.
The classic sentence to remember: you aggregate facts and filter/group by dimensions. "Total sales (fact) by product category (dimension) last quarter (dimension)" is the shape of nearly every analytical question.
Fact vs dimension tables
A fact table is long, narrow, and numeric; a dimension table is shorter, wider, and descriptive. The distinction is the heart of the model:
| Fact table | Dimension table | |
|---|---|---|
| Contains | Measures + foreign keys | Descriptive attributes |
| Example columns | quantity, amount, *_key |
product_name, category, city |
| Rows | Many (one per event) | Fewer (one per entity) |
| Grows | Constantly (every transaction) | Slowly |
| You do this to it | Aggregate (SUM, COUNT, AVG) | Filter, group by |
| Example | fct_sales, fct_orders |
dim_product, dim_customer |
A naming convention makes models readable: prefix facts with fct_ and dimensions with dim_. It's a small habit that pays off across a large warehouse.
The star schema
A star schema is one central fact table joined to surrounding dimension tables — the star shape. It's the default dimensional model because it makes queries both simple to write and fast to run.
Here's the star from the diagram, in SQL. The fact table references each dimension by key:
-- fact table: one row per sale, measures + foreign keys
CREATE TABLE fct_sales (
  sale_id       BIGINT,
  date_key      INT,      -- FK → dim_date
  product_key   INT,      -- FK → dim_product
  customer_key  INT,      -- FK → dim_customer
  store_key     INT,      -- FK → dim_store
  quantity      INT,
  amount        DECIMAL(12,2)
);
Answering a business question is then a clean join and aggregate:
-- total revenue by product category, last quarter
SELECT p.category,
       SUM(f.amount) AS revenue
FROM fct_sales   f
JOIN dim_product p ON f.product_key = p.product_key
JOIN dim_date    d ON f.date_key    = d.date_key
WHERE d.quarter = '2026-Q2'
GROUP BY p.category
ORDER BY revenue DESC;
Notice how readable that is — the join and GROUP BY map directly onto the business question. That readability is the whole point of the star schema.
Grain: the first decision
The grain is what a single fact row represents — declare it before anything else. Get this right and the model is flexible; get it wrong and every measure is suspect.
Grain examples, from finest to coarsest:
- One row per order line item (most atomic — recommended).
- One row per order.
- One row per customer per day (an aggregate/summary fact).
Always model at the most atomic grain you can. You can roll fine-grained facts up to any summary later, but you can never break a coarse-grained fact back down. Atomic grain future-proofs the warehouse against questions you haven't been asked yet.
Grain has also become the thing that decides whether an AI query assistant gives your business users the right number. A model reading your schema can see that orders and order_items are joinable; nothing in the DDL tells it that summing an order total after that join counts each order several times. A declared, atomic grain — and marts built at it — is what removes the guess. See text-to-SQL: why it fails and how to fix it.
Star vs snowflake schema
Star keeps each dimension as one flat table; snowflake normalizes dimensions into several linked tables. The trade-off is storage versus simplicity.
- Star schema —
dim_productholds product name, subcategory, and category all in one table. Denormalized, some repetition, but a single join. - Snowflake schema —
dim_productlinks todim_subcategory, which links todim_category. Normalized, less repetition, but more joins and complexity.
| Star | Snowflake | |
|---|---|---|
| Dimensions | Denormalized (flat) | Normalized (split) |
| Storage | More | Less |
| Query speed | Faster (fewer joins) | Slower (more joins) |
| Simplicity | Higher | Lower |
Prefer the star schema. Storage is cheap; analyst time and query performance are not. Most teams — and modern platforms like Databricks and Snowflake (the product, confusingly, not the schema) — favor star schemas. Reserve snowflaking for genuinely large, frequently-changing dimensions.
How to design a star schema (4 steps)
Kimball's four-step process turns a business process into a dimensional model:
- Choose the business process — the event to measure (sales, orders, shipments).
- Declare the grain — what one fact row means (one order line item).
- Identify the dimensions — the context: who, what, when, where (product, customer, date, store).
- Identify the facts — the numeric measures at that grain (quantity, amount).
Follow these in order and the star assembles itself. Skipping straight to tables — especially skipping the grain — is the most common way dimensional models go wrong.
Try it yourself — design a model
You're modeling a movie-streaming service and need to analyze viewing events.
- What's a sensible atomic grain for the fact table?
- Name three dimensions you'd create.
- Name two measures (facts) at that grain.
Show answers
- One row per user per title watched per session (atomic — a single viewing event).
dim_user,dim_title,dim_date(also good:dim_device,dim_country).minutes_watchedandcompletion_pct(also valid: aplay_countof 1 per row for easy COUNT-based aggregation).
Common mistakes in dimensional modeling
- Not declaring the grain first. Everything else depends on it; skipping it corrupts the model.
- Modeling at a summarized grain. You lose the ability to answer detailed questions later. Go atomic.
- Over-normalizing (snowflaking) everything. It adds joins and complexity for storage savings you rarely need.
- Putting descriptive text in the fact table. Names and categories belong in dimensions; facts hold measures and keys.
- Mixing grains in one fact table. Order-level and line-level rows in the same table cause double-counting.
Frequently Asked Questions
What is dimensional modeling?
Dimensional modeling is a data warehouse design technique that organizes data into fact tables and dimension tables to make analytical queries fast and intuitive. Fact tables store measurable events (like sales); dimension tables store descriptive context (product, customer, date). Popularized by Ralph Kimball, it optimizes for reading and analyzing data rather than transactional writes.
What is a star schema?
A star schema is the most common dimensional model: a central fact table connected to several dimension tables, forming a star. The fact table holds measures and foreign keys; each dimension holds descriptive attributes. Queries join the fact to the dimensions they need. It's deliberately denormalized so analysts can slice and aggregate with simple, fast joins.
What is the difference between a fact table and a dimension table?
A fact table stores measurable events — numeric measures like quantity and amount — plus foreign keys to dimensions. A dimension table stores descriptive context: names, categories, dates, locations. Fact tables are long and narrow; dimension tables are shorter and wider. You aggregate facts and filter or group by dimensions.
What is the difference between a star schema and a snowflake schema?
In a star schema, dimensions are denormalized into single flat tables. In a snowflake schema, dimensions are normalized into multiple related tables. Star schemas use more storage but are simpler and faster to query; snowflake schemas save space but add join complexity. Most analytics teams prefer star schemas — see normalization vs denormalization for the full trade-off and when duplicating a column is worth it.
What is the grain of a fact table?
The grain is the level of detail one fact row represents — one order line, one day, one transaction. Declaring the grain is the first and most important step in dimensional modeling, because every measure and dimension must match it. An atomic (most detailed) grain keeps the model flexible and prevents double-counting.
Conclusion
Dimensional modeling shapes data for analysis by separating facts from dimensions, and the star schema is its signature form — one fact table, many dimensions, simple fast joins. Declare the grain first, model at the most atomic level, keep dimensions flat, and prefer star over snowflake. Do that and your warehouse answers business questions with queries that read almost like English.
Next in the free Learn Data Engineering course: Slowly Changing Dimensions (SCD Type 2) — how to handle dimensions whose attributes change over time without losing history. Designing a warehouse or analytics layer for real use? Tell us what you're modelling — a grain fixed now is far cheaper than a grain fixed later.
Mohammed Yaseen
Founder, SolutionGigs
Mohammed designs dimensional models and warehouse schemas in production and teaches the data modeling track of the free Learn Data Engineering course. LinkedIn →
More in Data Engineering
Slowly Changing Dimensions (SCD Type 2) Explained
Slowly Changing Dimensions (SCD Type 2) explained — track dimension history with valid_from, valid_to and is_current, the SCD types compared, and SQL to implement it.
What Is Data Engineering? The Role Explained
What is data engineering? A clear explanation of the role — what a data engineer does day to day, the tools they use, how it differs from data science and analytics, and how to start.
Batch vs Streaming: Architecture, Latency Tradeoffs & Decision Rules
Batch vs streaming data processing explained — the real differences, latency and cost trade-offs, micro-batching, and a decision framework for when to choose each in 2026.