
Databricks Job Failed: How to Find the Real Cause
A failed Databricks job is really one of four different failures, each with its own log, its own fix and its own owner. Route it before you debug it. This guide gives you the 60-second routing model instead of another alphabetical error-code list, plus three traps that cost real money: the Repair run button that silently duplicates data because Databricks does not make tasks idempotent, the retry policy that bills 5.2x a clean run with 35% of it an idle cluster, and the concurrency default that skips runs without ever firing an alert. Includes the Databricks Runtime 13.3 LTS end-of-support date and the system table queries that find your real top failure causes.

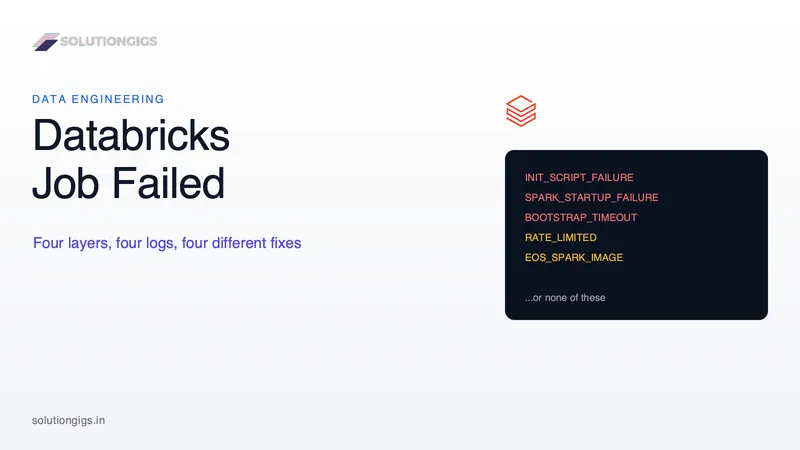
Quick Answer: A failed Databricks job is really one of four different failures, and each has a different log, a different fix, and a different owner. The compute may never have started, which produces a cluster termination code and is unrelated to your code. The task may never have run because the job hit its concurrency limit. Your code may have failed on a perfectly healthy cluster. Or the job may have "succeeded" while writing wrong data. Route the failure to its layer first — the error the run page shows you is frequently produced by a different layer than the one that actually broke.
Every guide to Databricks job failures is an alphabetical list of error codes. That is a reference, not a method, and it is why engineers spend an afternoon rewriting a notebook that never ran a single line.
The useful skill is routing: deciding, in about sixty seconds, which of four layers broke. Once you know the layer, the fix is usually short and often has nothing to do with your PySpark. Once you don't, you are guessing.
This guide gives you the routing model, the error codes that matter at each layer, and three traps that cost real money — the Repair run button that silently duplicates data, the retry policy that bills 5.2× a clean run, and the failure mode that never fires an alert because Databricks does not classify it as a failure at all.
Why "job failed" is four different failures
A Databricks job run passes through four independent layers, and a failure at any one of them surfaces in the UI as the same red "Failed" badge. The layers do not share a log, and they do not share an owner.
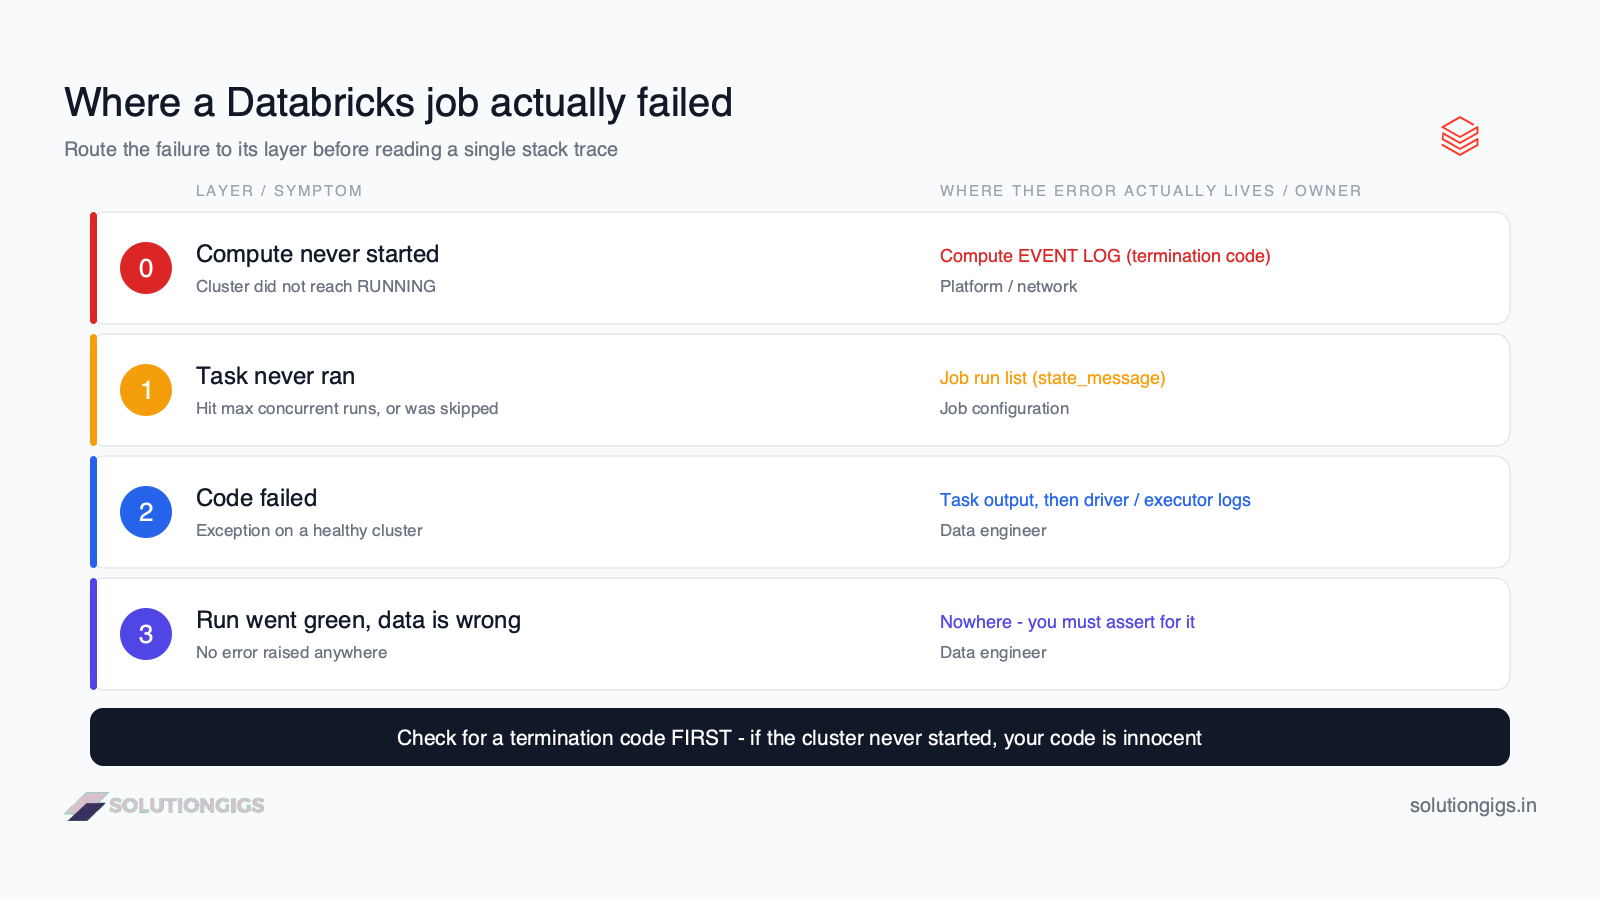
| Layer | What broke | Where the error actually lives | Owner |
|---|---|---|---|
| 0. Compute | The cluster never reached a running state | Compute event log (termination code) | Platform / cloud / network |
| 1. Orchestration | The task never started, or was skipped | Job run list, state_message |
Job configuration |
| 2. Execution | Your code failed on a healthy cluster | Task output, then driver/executor logs | Data engineer |
| 3. Correctness | The run went green and the data is wrong | Nowhere — you have to look for it | Data engineer |
The critical detail: the message the run details page shows first is almost always a Layer 2 message, because that is the surface the task runner reports on. When the real cause is Layer 0, that message is a generic downstream symptom — "run failed with unexpected error" or a truncated Spark message — and it will send you straight into the notebook you did not need to open.
The sixty-second routing rule. Before reading any stack trace, open the run's compute tab and look for a termination code. If there is one, the failure is Layer 0 and your code is innocent. If the cluster reached
RUNNING, the failure is Layer 2 or 3. If there is no run at all where you expected one, it is Layer 1.
Layer 0 — The compute never started
When a cluster fails to launch, Databricks records a termination code in the compute event log, and no line of your notebook ever executed. Reading these codes is the single highest-leverage troubleshooting skill on the platform, because roughly half of "random" job failures in a locked-down enterprise network live here.
These are the codes worth memorising, from the Databricks classic compute termination error codes reference{target="_blank" rel="noopener"}:
| Termination code | What it really means | The fix |
|---|---|---|
INIT_SCRIPT_FAILURE |
A cluster-scoped init script was unfetchable or exited non-zero | Verify the path still exists and the cluster identity can read it; read the init script logs |
SPARK_STARTUP_FAILURE |
Driver missed its 200 second startup deadline | Strip custom Spark configs and init scripts to isolate; try another instance type |
BOOTSTRAP_TIMEOUT_DUE_TO_MISCONFIG |
VM bootstrap exceeded 700 seconds | Network. Open connectivity to the control plane and artifact storage; add VPC endpoints |
CLOUD_PROVIDER_LAUNCH_FAILURE |
AWS/Azure/GCP could not launch the VM | Usually transient — retry. Persistent means a cloud-side issue |
AWS_INSUFFICIENT_INSTANCE_CAPACITY_FAILURE |
No capacity for that instance type in that AZ | Enable auto AZ selection, or allow a fleet of instance types |
AWS_INSUFFICIENT_FREE_ADDRESSES_IN_SUBNET_FAILURE |
The subnet ran out of IPs | Expand the CIDR range or spread across AZs — the classic Monday-morning failure |
AWS_RESOURCE_QUOTA_EXCEEDED |
Account quota hit | Request an increase; clean up abandoned clusters |
SPOT_INSTANCE_TERMINATION |
Your spot nodes were reclaimed | Move production to on-demand, or run a mixed fleet |
NPIP_TUNNEL_SETUP_FAILURE |
Secure cluster connectivity relay unreachable | Open 443/6666 to the SCC relay endpoint |
INSTANCE_POOL_MAX_CAPACITY_REACHED |
Pool is full | Raise the pool maximum or stagger schedules |
RATE_LIMITED / REQUEST_THROTTLED |
Too many simultaneous launches | Stagger job start times — see below |
EOS_SPARK_IMAGE |
The pinned runtime has reached end of support | Upgrade the runtime version |
The pattern behind half of these
Look at the fixes and a shape appears: BOOTSTRAP_TIMEOUT, NPIP_TUNNEL_SETUP_FAILURE, NETWORK_CHECK_DNS_SERVER_FAILURE, NETWORK_CHECK_STORAGE_FAILURE, CONTROL_PLANE_REQUEST_FAILURE and STORAGE_DOWNLOAD_FAILURE_SLOW are all the same failure wearing different labels — a VM in your VPC cannot reach something it needs.
So when any of them appear, do not debug them individually. Check the four egress paths a Databricks VM requires: the control plane, artifact storage, DNS on port 53, and the cloud metadata endpoint at 169.254.169.254. A single over-tight security group or a TLS-inspecting proxy breaks several at once, which is exactly why the codes look random.
The 03:00 thundering herd
RATE_LIMITED and REQUEST_THROTTLED have a specific and very common trigger: every job in the workspace is scheduled on the hour. Fifty jobs launching fifty clusters at 0 0 3 * * ? hammer the cloud provider's API, get throttled, and a handful fail while the rest succeed — producing failures that look non-deterministic because they are.
The fix costs nothing: spread schedules across the hour, and use instance pools so warm VMs are claimed instead of launched. This also removes several minutes of spin-up from every run, which matters for the cost arithmetic below.
The runtime end-of-support cliff nobody diarised
EOS_SPARK_IMAGE deserves its own warning because it arrives on a date, not on a change you made.
Databricks Runtime versions move through GA (about six months) into LTS for three years, then to end of support (EOS), then end of life (EoL). At EOS the version receives no support and no backported fixes, and — the part that bites — it is no longer selectable in the UI when you create or update compute. At EoL, workloads on it fail outright.
| LTS version | End of support |
|---|---|
| 13.3 LTS | 22 August 2026 |
| 14.3 LTS | 1 February 2027 |
| 15.4 LTS | 19 August 2027 |
| 16.4 LTS | 9 May 2028 |
Databricks Runtime 13.3 LTS goes end of support on 22 August 2026 — days from this article's publication. If any of your jobs pin 13.3.x-scala2.12 in Terraform, a Databricks Asset Bundle, or a JSON job definition, they are the ones to audit this week. Because the version disappears from the UI first, the failure is doubly annoying: you cannot spin up a matching interactive cluster to reproduce it.
Find every pinned runtime in one query — the system tables know:
SELECT DISTINCT
  j.name                                   AS job_name,
  t.compute_key,
  t.task_key
FROM system.lakeflow.job_tasks t
JOIN system.lakeflow.jobs j USING (workspace_id, job_id)
WHERE j.delete_time IS NULL
ORDER BY job_name;
Then grep your infrastructure repo for spark_version and upgrade anything on 13.3 to 15.4 LTS, which buys you until August 2027.
Layer 1 — The task never ran, and nothing alerted
This is the failure mode that costs the most and is discovered the latest, because Databricks does not classify it as a failure.
Every Databricks job has a maximum concurrent runs setting that defaults to 1. When a scheduled run is triggered while the previous run is still going, one of two things happens:
- Queueing enabled → the new run waits (up to 48 hours) and then executes.
- Queueing disabled → the new run is skipped.
A skipped run is not a failed run. It produces no failure state, so your on-failure notifications never fire, your PagerDuty integration stays quiet, and your dashboard shows no red. The table simply does not get its 03:00 load, and somebody notices on Thursday.
Queueing is enabled by default only for jobs created through the UI after 15 April 2024. Jobs created earlier, or created through the Jobs API, Terraform, or Asset Bundles, are exactly the ones most likely to be missing it — which means your most production-critical, most-automated pipelines are the most exposed.
Two fixes, and you want both:
- Set queueing explicitly in code, so it survives every redeploy:
{
  "name": "nightly_silver_load",
  "queue": { "enabled": true },
  "max_concurrent_runs": 1,
  "timeout_seconds": 7200
}
- Alert on missing successes, not just on failures. A schedule-aware check is the only thing that catches a skip:
-- Jobs that produced no successful run in the last 24 hours
SELECT
  j.name,
  MAX(r.period_end_time) AS last_success
FROM system.lakeflow.job_run_timeline r
JOIN system.lakeflow.jobs j USING (workspace_id, job_id)
WHERE j.delete_time IS NULL
GROUP BY j.name
HAVING MAX(r.period_end_time) < current_timestamp() - INTERVAL 24 HOURS;
Note the timeout_seconds in that JSON. A job with retries but no timeout can hang forever, holding a billed cluster open and blocking every subsequent scheduled run — which then all silently skip. The two settings are a pair; shipping one without the other is how a single stuck task takes out a week of loads.
Layer 2 — Your code failed on a healthy cluster
If the cluster reached RUNNING and the task produced a stack trace, you are in normal Spark debugging territory — with three exceptions that only ever appear when the notebook runs as a job.
The three failures that only happen under the scheduler
These are what people mean when they say "it works in my notebook but fails as a job."
1. dbutils.library.restartPython() forcibly terminates the Python process. Interactively, the notebook simply reconnects and you never notice. Under the job runner, that termination is read as an unexpected shutdown and the run is marked cancelled or failed. Remove it from any notebook that runs as a job.
2. Multiple separate %pip install cells. Each one can trigger its own environment restart, so a notebook with four install cells may restart its Python environment four times during startup. Consolidate into a single %pip install a b c, or better, declare dependencies at the task level so they resolve before execution.
3. Identity. An interactive run uses your credentials. A scheduled run uses the job owner or an assigned service principal. If that identity lacks SELECT on a Unity Catalog table or access to the storage credential, you get a permission error on code that works perfectly for you. Check the compute access mode before the grants — jobs compute created without an explicit access mode cannot reach Unity Catalog at all. Before debugging anything else, confirm which identity the run used — and grant to a group, never to the individual principal, or the next rotation breaks it again.
The genuine Spark failures
The rest are ordinary Spark problems, and they have their own dedicated playbooks:
java.lang.OutOfMemoryErroror exit code 137 — the executor was killed. The cause is almost never "the cluster is too small"; see our guide to Spark out of memory errors for why reaching for a bigger instance first is the expensive mistake.- One task runs for 40 minutes while 199 finish in 30 seconds — that is Spark data skew, and it holds the entire billed cluster open for the straggler.
FileNotFoundExceptionon a path that exists — usually a stale cache or a concurrent write, and often accompanied by the small files problem.- The job got slower without a code change — check partition counts and shuffle behaviour before blaming the platform; executor tuning is the usual lever.
Serverless changes the failure surface
If you run on serverless compute, Layer 0 largely disappears — and with it, most of the internet's Databricks troubleshooting advice. There is no cluster you own, no compute event log, and no termination code. When a serverless run fails during startup, the Jobs service often cannot retrieve a detailed reason from the compute layer at all, producing an error that points at no line in your source.
The corresponding new failure mode is that the runtime changes underneath you. A bundle-deployed job that ran fine for weeks can start failing because the serverless environment version moved. Pin the environment version in your job definition rather than floating on latest, and treat an unexplained serverless failure with an unchanged codebase as an environment-version question first.
Layer 3 — The run went green and the data is wrong
The most expensive Databricks failure is the one that reports success. A task that catches its own exceptions, a MERGE that matched nothing, an upstream source that returned an empty file — all produce a green run and a silently wrong table.
The only defence is to make correctness a task that can fail. Add an assertion step after the write:
from pyspark.sql import functions as F

expected_min = 100_000
actual = spark.table("silver.orders") \
    .filter(F.col("load_date") == run_date) \
    .count()

if actual < expected_min:
    raise ValueError(
        f"Row count check failed for {run_date}: got {actual:,}, expected >= {expected_min:,}"
    )
Four lines that turn an invisible data incident into a job failure with an alert attached. If you are on Unity Catalog, Lakeflow's built-in data quality expectations do the same thing declaratively.
Before you click "Repair run": the duplicate-data trap
This is the single most important paragraph in this article. Repair run is the button everyone reaches for after a failure, and Databricks' own documentation carries a warning that almost no third-party guide repeats:
Lakeflow Jobs doesn't make tasks idempotent, so if a task wrote part of its output before it failed, re-running it can duplicate that data.
A repair re-runs each unsuccessful task from the beginning. It does not resume. So if your failed task did this:
# UNSAFE under repair — the partial write is never rolled back
df.write.mode("append").saveAsTable("silver.orders")
...and it failed after writing 700,000 of 1,000,000 rows, the repair writes all 1,000,000 again. You now have 1.7 million rows, a green run, and no warning anywhere in the interface.
| Write pattern | Safe to repair? | Why |
|---|---|---|
.mode("overwrite") |
✅ Yes | Replaces the partition or table wholesale |
MERGE INTO ... WHEN MATCHED |
✅ Yes | Keyed upsert; re-running converges |
.mode("append") |
⛔ No | Partial rows survive and are written twice |
| Streaming with checkpoint | ✅ Yes | The checkpoint tracks committed offsets |
| External API call / email send | ⛔ No | Side effects are not transactional |
Before repairing, ask one question: what did this task write? If the answer involves append or a side effect, clean up the partial write first, or convert the task to an idempotent pattern and then repair.
Two more things worth knowing about repair. First, tasks sharing a job cluster get a brand new cluster on repair (my_job_cluster_v1), so you pay a fresh spin-up. Second, repair only exists for multi-task jobs — a single-task job has to be re-run in full, which is a good argument for splitting long single-task pipelines into stages.
What a retry policy actually costs
Retries are not free, because the job cluster stays up and billing through the retry wait interval. This is the term nobody models, so here it is worked end to end.
Take a nine-node Jobs Compute cluster consuming 10 DBU/hour at $0.15/DBU, on VMs at $0.40/node/hour:
DBU cost   = 10 × $0.15            = $1.50/hr
VM cost    =  9 × $0.40            = $3.60/hr
Cluster    =                         $5.10/hr
Now give it a realistic failure: five minutes of cluster spin-up, a task that runs for twenty minutes before failing, max_retries = 3, and a fifteen-minute retry wait.
| Minutes billed | Cost | |
|---|---|---|
| Clean run (startup + task) | 25 | $2.12 |
| Failed run with 3 retries | 130 | $11.05 |
| Of which: idle retry wait | 45 | $3.82 |
A single failing task costs 5.2× a successful run — and 35% of that spend is a cluster sitting idle, computing nothing, waiting out the retry interval. Multiply by a job that fails every night for a week before anyone looks at it.
Three conclusions follow:
- Never retry a deterministic failure. A bad schema or a null-pointer bug will fail identically three more times, at full price. Retries exist for transient faults — spot reclamation, a throttled cloud API, a flaky external source.
- Keep the retry wait short where the fault is transient, and set
max_retries = 0where it is not. The default instinct to "add retries for safety" is a cost decision disguised as a reliability decision. - Always pair retries with a timeout. Without one, the worst case is unbounded.
If this is the first time you have seen your cluster cost broken into DBU and VM terms, our guide to reducing Databricks costs works the same arithmetic across the whole bill — including why the DBU rate is the least useful number on your invoice.
Stop firefighting: find your real top failure causes
Individual troubleshooting is reactive. The system tables let you see which failures actually dominate your workspace, which is usually a surprise — most teams discover that two or three causes account for the large majority of failures, and neither is the one they have been manually restarting.
-- Top failure causes across the workspace, last 30 days
SELECT
  r.termination_code,
  COUNT(*)                        AS failures,
  COUNT(DISTINCT r.job_id)        AS jobs_affected,
  ROUND(100.0 * COUNT(*) / SUM(COUNT(*)) OVER (), 1) AS pct_of_failures
FROM system.lakeflow.job_run_timeline r
WHERE r.result_state IN ('FAILED', 'TIMEDOUT')
  AND r.period_start_time >= current_date() - INTERVAL 30 DAYS
GROUP BY r.termination_code
ORDER BY failures DESC;
Run it monthly. If RATE_LIMITED or AWS_INSUFFICIENT_INSTANCE_CAPACITY_FAILURE tops the list, your problem is scheduling, not code — and it is fixable in an afternoon. If a single job dominates jobs_affected, fix that job and your failure rate collapses.
Pair it with the run-duration trend so you catch the jobs drifting toward their timeout before they cross it. A job whose runtime has doubled over a month is a failure that has not happened yet.
Common mistakes that keep jobs failing
- Debugging the notebook when the cluster never started. Always check for a termination code first. This one mistake accounts for most wasted troubleshooting time.
- Clicking Repair run on an append-mode task. Silent data duplication with a green badge. Check the write pattern first.
- Adding retries to a deterministic bug. Three identical failures at 5.2× the price.
- Setting retries without a timeout. An unbounded hang that also blocks every following run.
- Alerting only on failure. Skipped runs never alert. Alert on missing successes.
- Scheduling everything on the hour. Self-inflicted
RATE_LIMITED, appearing as random failures. - Granting permissions to a person, not a group. Works today, breaks at the next rotation.
- Leaving runtime versions pinned and undiarised. Then 22 August 2026 arrives.
- Trusting a green run. Add a row-count assertion; four lines beats a week of wrong dashboards.
Frequently Asked Questions
Why did my Databricks job fail?
A Databricks job fails at one of four layers, and the fix is different at each. The compute may never have started, which produces a cluster termination code and has nothing to do with your code. The task may never have run because the job hit its concurrency limit. Your code may have failed on a healthy cluster. Or the job may have succeeded while writing wrong data. Identify the layer before you change anything.
Where do I find the real Databricks job error message?
It depends on the layer. Task output shows Python and SQL exceptions. Cluster termination codes live in the compute event log, not the task output. Executor stack traces and out-of-memory kills live in the driver and executor logs, which need cluster log delivery configured. Workspace-wide history lives in system.lakeflow. Most engineers read only the first of these four, which is why compute failures get misdiagnosed as code bugs.
Is it safe to use Repair run on a failed Databricks job?
Only if your tasks are idempotent. Databricks documents that Lakeflow Jobs does not make tasks idempotent, and a repair re-runs each unsuccessful task from the beginning. If a task appended rows before it failed, repairing appends them again and silently duplicates data. Repair is safe with overwrite and MERGE, unsafe with append. Nothing in the interface warns you.
Why did my Databricks job get skipped instead of failing?
Because it hit its maximum concurrent runs limit, which defaults to 1 for every new job. If a run is still going when the next is triggered and queueing is off, Databricks skips the new run rather than failing it. A skipped run is not a failure, so on-failure alerts never fire. Enable queueing explicitly and alert on missing successes.
Why does my notebook work interactively but fail as a scheduled job?
Three usual causes: dbutils.library.restartPython(), which the job runner reads as an unexpected shutdown; several separate %pip install cells, each triggering an environment restart; and identity, because interactive runs use your credentials while scheduled runs use a service principal that may lack permissions. Consolidate pip installs, remove restartPython, and test as the service principal.
What does INIT_SCRIPT_FAILURE mean in Databricks?
It means a cluster-scoped init script could not be fetched or exited non-zero during startup, so the cluster never reached a running state and your notebook never executed. Check the script path still exists, that the cluster identity can read it, and read the init script logs for the failing command. Init scripts also commonly cause SPARK_STARTUP_FAILURE, where the driver misses its 200-second deadline.
Do Databricks job retries cost money?
Yes, and more than most teams expect, because the job cluster stays running and billing during the retry wait. On a nine-node Jobs Compute cluster at about $5.10 an hour, a task running 20 minutes before failing with three retries and a 15-minute wait bills 130 minutes instead of 25 — roughly 5.2× a clean run, with 35% of that being an idle cluster doing no compute at all.
Conclusion
The reason Databricks job failures feel chaotic is that four unrelated systems report through one status badge. Once you separate them, most failures resolve quickly: check for a termination code first, because if the compute never started your code is not the problem; confirm the run actually ran and was not silently skipped; then, and only then, read the stack trace.
Three habits will remove most of the pain. Never repair an append-mode task without checking what it wrote. Never add retries to a deterministic failure, because it costs 5.2× and fixes nothing. And alert on missing successes, not only on failures, because the run that never happened is the one nobody finds until Thursday.
If your jobs are pinned to Databricks Runtime 13.3 LTS, audit them this week — end of support lands on 22 August 2026 and takes the version out of the UI with it.
At SolutionGigs we write these guides from production data pipelines, not from documentation summaries. If you want to size the cluster properly before the next failure, try our free Spark Config Optimizer — and browse the rest of our data engineering guides for the deeper Spark and Databricks playbooks referenced above.
Running the same workloads on EMR? The layering idea transfers but the stages and logs differ - see AWS EMR troubleshooting.
Job still failing after working through all of this? Paste me the error and the cluster event log and I'll work out what's actually causing it rather than what it looks like. You get a diagnosis and a price before any paid work starts.
Mohammed Yaseen
Founder, SolutionGigs
Mohammed builds and operates production Spark and Databricks pipelines, and has spent more nights than he would like reading cluster event logs to find out that the notebook was never the problem. LinkedIn →
Try Free Spark Config Optimizer
Free, no signup — right in your browser.
Try Free Spark Config Optimizer →More in Data Engineering
Build Your First ETL Pipeline in Python (Tutorial)
Build your first ETL pipeline in Python step by step — extract from CSV, transform and clean with pandas, and load to Parquet or a database, with a full runnable script and best practices.
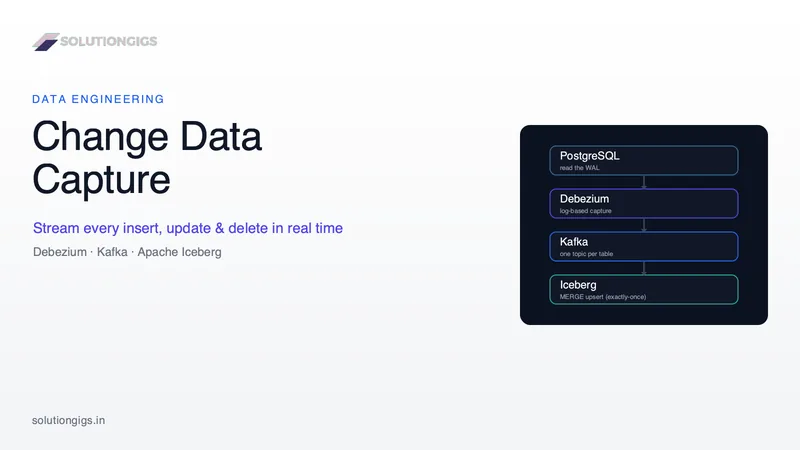
Change Data Capture (CDC) Explained: Debezium, Kafka & Iceberg
Change Data Capture streams every insert, update, and delete out of your database in real time by reading its transaction log — not polling. Learn log-based CDC with Debezium, Kafka Connect, and an Iceberg sink: full Postgres config, the MERGE that makes it exactly-once, schema-change handling, and the replication-slot gotcha that fills your disk.
Data Engineer vs AI Engineer: Skills, Scope, Salary and Which to Pick
Data engineer vs AI engineer, decided on evidence: the WEF projects big data specialists at 110% growth to 2030 against 85% for AI and ML specialists, while Robert Half puts AI pay 9% ahead at the midpoint. Wider scope on one side, bigger premium on the other. Inside: a 12-row comparison table, US and India pay bands with their caveats, the stat every career post miscites, an original map showing a RAG pipeline IS an ETL pipeline stage for stage, an honest ledger of what transfers and what does not, and a 90-day plan to move from data to AI.