
AWS EMR Troubleshooting: How to Diagnose a Failed Cluster
An Amazon EMR job fails at one of four stages - provisioning, bootstrap, step or YARN container - and each writes to a different log. Map the stage first. This guide gives you every stage's log path, then names the three most-repeated EMR fixes on the internet that are obsolete or actively harmful: EMRFS consistent view, redundant since S3 went strongly consistent in December 2020 and still billing you for a DynamoDB table; disabling the YARN vmem check, which the error message itself recommends but which only removes the detector node-wide; and raising fs.s3.maxRetries for 503 Slow Down, when the S3 quota is per prefix. Plus the memoryOverhead ceiling that turns a crash into an indefinite ACCEPTED hang, and the EMR release-support clock that expired on 7.2.0 in July 2026.

Quick Answer: An Amazon EMR job fails at one of four stages — provisioning (EC2 could not supply the instances), bootstrap (a bootstrap action exited non-zero), step (your application failed), or YARN container (an executor was killed) — and each stage writes to a different log path. Read the cluster's termination reason first, because it tells you which of the four logs is worth opening. Then be aware that three of the most-repeated EMR fixes on the internet are obsolete or actively harmful, including the one the error message itself recommends.
Amazon EMR troubleshooting has a specific frustration: the console tells you the cluster is TERMINATED_WITH_ERRORS, and that phrase covers four completely unrelated failures with four different owners.
Worse, EMR is old enough that a decade of stale advice outranks the current answer. Some of the top results for common EMR errors still recommend a feature AWS deprecated in 2023, and the single most-cited fix for the most common EMR error is a suggestion printed by the error message itself — which quietly makes the problem harder to find.
This guide gives you the routing model, a log-path map, the fixes that actually work, and an explicit list of the advice you should ignore.
How to troubleshoot a failed EMR cluster in 5 steps
Work outward from the termination reason, not inward from the stack trace. These five steps resolve the large majority of EMR failures:
- Read the termination reason. Cluster → Summary → state change reason. It names the failing stage.
- Wait five minutes. EMR uploads logs to S3 every five minutes. An empty bucket right after a failure means nothing.
- Check bootstrap logs first if the cluster never reached
RUNNING→node/*/bootstrap-actions/*/stderr.gz. - Read the step logs if a step failed →
controller.gzfor launch errors,stderr.gzfor the application trace. - Drill into container logs if the step launched but tasks died →
containers/application_*/container_*/stderr.gz.
That five-minute upload delay in step 2 costs people more time than any single error code. Engineers open the log bucket, find nothing, and conclude logging is broken.
The four stages an EMR job can fail at
Every EMR failure belongs to exactly one stage, and the stage determines both the log and the fix.
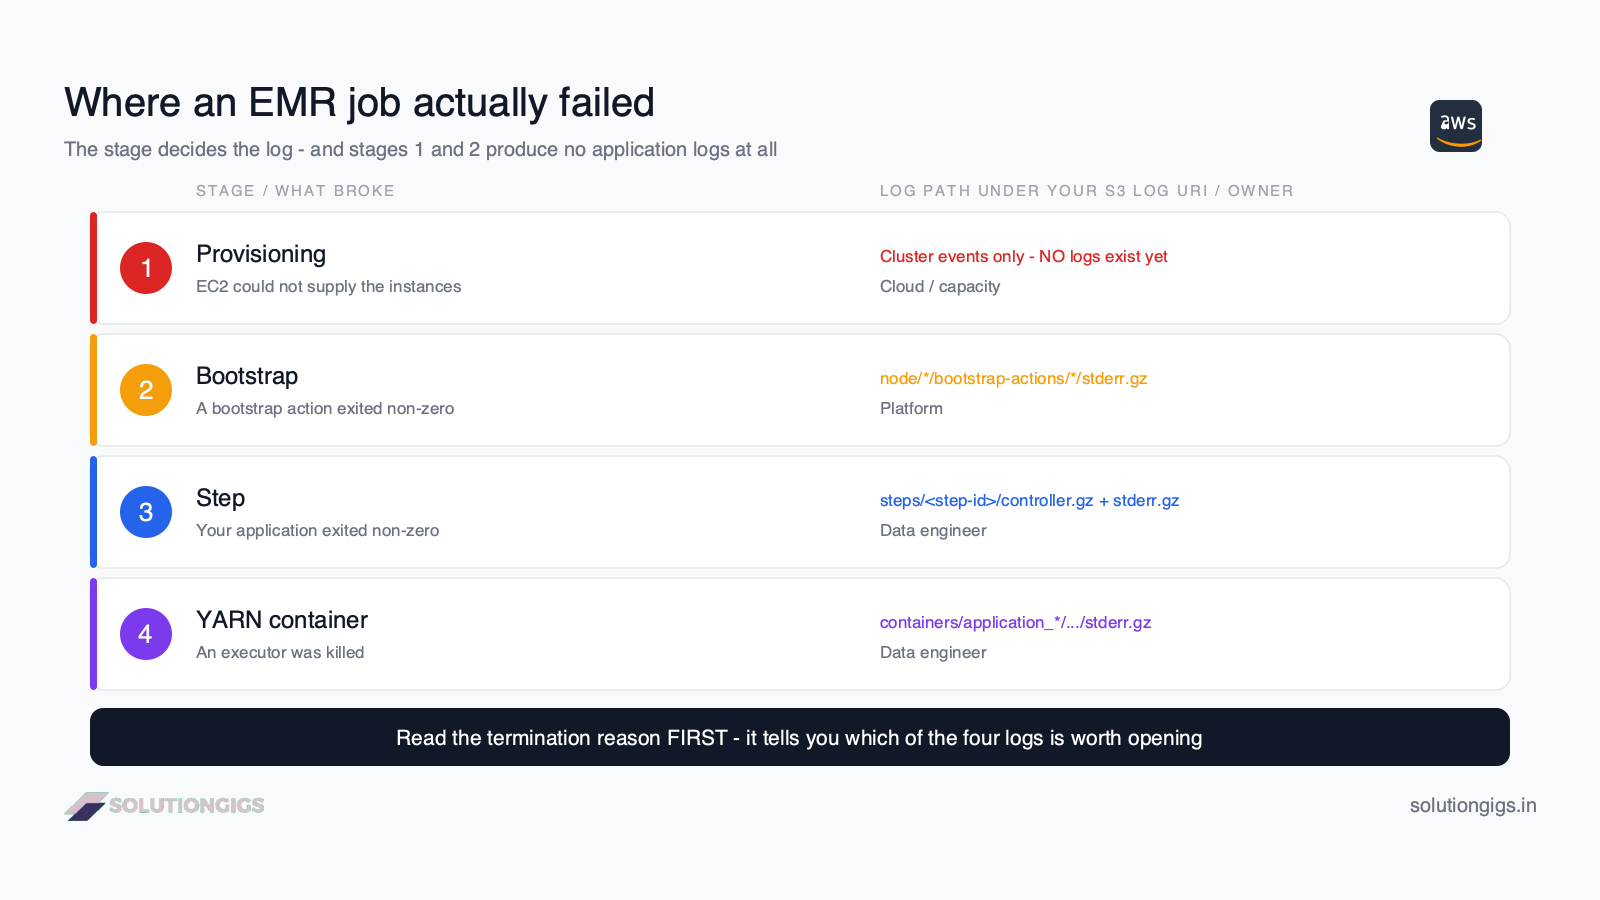
| Stage | What broke | Log path (under your S3 log URI) | Owner |
|---|---|---|---|
| 1. Provisioning | EC2 could not supply instances | Cluster events only — no logs exist yet | Cloud / capacity |
| 2. Bootstrap | A bootstrap action exited non-zero | node/<id>/bootstrap-actions/<n>/stderr.gz |
Platform |
| 3. Step | Your application exited non-zero | steps/<step-id>/controller.gz, stderr.gz |
Data engineer |
| 4. Container | An executor was killed | containers/application_*/container_*/stderr.gz |
Data engineer |
The important asymmetry: stages 1 and 2 produce no application logs at all, because your code never ran. If you are reading a Spark stack trace for a cluster that failed at bootstrap, you are reading a log from a previous run.
Where are EMR logs stored?
Amazon EMR writes logs to /mnt/var/log on the primary node, and copies them to your S3 log URI every five minutes if logging was enabled at cluster creation.
| Log file | What it contains | When to read it |
|---|---|---|
controller.gz |
EMR's own record of trying to run the step | Step failed while launching |
stderr.gz |
Error output from the application | The usual stack trace |
stdout.gz |
Application status output | Rarely — but the only place print() lands |
syslog.gz |
Hadoop / Spark framework logs | Framework-level errors |
bootstrap-actions/*/stderr.gz |
Bootstrap script output | Cluster died before RUNNING |
containers/.../stderr.gz |
Per-executor logs | Task-level failures, OOM kills |
Logging is opt-in and cannot be added later. If you did not set a log URI when you created the cluster, the logs exist only on the primary node — and a terminated cluster's primary node is gone. Always set a log URI, and enforce it in your cluster template.
Stage 1 — Provisioning failures
A provisioning failure means EMR never got the EC2 capacity it asked for, so no logs exist and nothing about your code is relevant. The common causes and their fixes:
Insufficient capacityfor the instance type in that AZ — use instance fleets with several instance types and let EMR pick, rather than a fixed instance group. This one change eliminates most capacity failures.- Subnet has no free IP addresses — a
/28subnet holds 11 usable IPs. A 20-node cluster cannot fit. Expand the CIDR or use a larger subnet. - Service quota exceeded — vCPU limits are per-region and per-family; request an increase before you need it.
- Spot capacity reclaimed mid-launch — set an on-demand core fleet and keep spot for task nodes only.
The last point deserves emphasis. Never run the primary or core nodes on spot. Losing a task node costs you re-executed tasks; losing a core node costs you HDFS data and usually the cluster.
Stage 2 — Bootstrap action failures
If a bootstrap action returns a non-zero exit code, EMR terminates that instance — and if enough instances fail, it deletes the entire cluster. These are the documented codes:
BOOTSTRAP_FAILURE_PRIMARY_WITH_NON_ZERO_CODE— the script ran and failed. TheErrorDataarray gives you the instance ID, which bootstrap action (1-indexed), the return code, and the S3 location.BOOTSTRAP_FAILURE_BA_DOWNLOAD_FAILED_PRIMARY— the script could not be downloaded. Almost always the EC2 instance profile lackings3:GetObject, or a moved path.BOOTSTRAP_FAILURE_FILE_NOT_FOUND_PRIMARY— downloaded, then not found where expected.
Three causes account for most real bootstrap failures:
- Permissions. The EC2 instance profile reads the script, not your user role. Those are different identities, and this is the single most common mistake.
- Line endings. A script saved with CRLF fails with a cryptic
bad interpretererror. Rundos2unixbefore uploading. - No error handling. Add
set -euo pipefailto the top of every bootstrap script so it fails loudly at the actual failing command rather than continuing into a confusing state.
Also: bootstrap actions have a time budget. A script that pulls large packages over a slow NAT gateway can exceed it, producing a timeout that looks like a network fault. Bake heavy dependencies into a custom AMI instead of installing them at boot.
Stage 3 and 4 — Step and container failures
Once the cluster reaches RUNNING, you are debugging Spark or Hadoop, and the most common error by far is a YARN memory kill.
Container killed by YARN for exceeding memory limits.
16.9 GB of 16 GB physical memory used.
Consider boosting spark.yarn.executor.memoryOverhead or
disabling yarn.nodemanager.vmem-check-enabled.
Read that last line carefully, because half of it is bad advice, and it is printed by AWS's own error message — which is why it has been copied into hundreds of blog posts.
The right fix
Raise spark.executor.memoryOverhead. It defaults to the greater of 10% of executor memory or 384 MB, and it covers off-heap allocations: JVM thread stacks, native libraries, memory-mapped files, and Python worker processes in PySpark. PySpark jobs blow through the default routinely, because the Python interpreter's memory is entirely off-heap and invisible to the JVM.
But there is a ceiling that almost nobody mentions:
spark.executor.memory + spark.executor.memoryOverhead
        must stay below
yarn.nodemanager.resource.memory-mb
Cross that line and YARN cannot schedule the container at all. Your application does not crash — it sits in ACCEPTED state forever, waiting for resources that can never exist. You have converted a loud failure into a silent hang, which is strictly worse, and it is the usual reason "I increased the memory and now it just hangs."
The wrong fix
Do not set yarn.nodemanager.vmem-check-enabled = false. It is the internet's most popular EMR fix and it does not fix anything.
The virtual memory check is a detector. Disabling it removes the alarm while leaving the memory pressure exactly where it was. The job then either succeeds by luck, or dies later with a less informative error, or takes the node with it — and because the check is a NodeManager-level setting, you have disabled it for every application on that node, not just yours.
It has one legitimate use: as a temporary diagnostic to confirm the virtual-to-physical ratio is the trigger. Then you fix the real cause.
For the underlying memory problem itself, the mechanics are the same as anywhere else in Spark — our guides to Spark out of memory errors, data skew and executor tuning cover the diagnosis in depth.
The EMR advice you should stop following
EMR has been generally available since 2009, and a large amount of highly-ranked troubleshooting content predates changes that made it wrong. Three specific examples:
| Common advice | Status | What to do instead |
|---|---|---|
"Enable EMRFS consistent view to fix FileNotFoundException" |
⛔ Obsolete since 2020 | Nothing — S3 is strongly consistent. Turn it off and delete the DynamoDB table |
"Disable yarn.nodemanager.vmem-check-enabled" |
⛔ Removes the detector | Raise memoryOverhead, within the NodeManager ceiling |
"Raise fs.s3.maxRetries to fix 503 Slow Down" |
⚠️ Treats the symptom | Spread writes across prefixes; consider AIMD retries |
EMRFS consistent view is dead
Amazon S3 gained strong read-after-write consistency on 1 December 2020, which made EMRFS consistent view redundant overnight. AWS ended standard support for it in future EMR releases on 1 June 2023.
It is not merely unnecessary. When enabled it provisions a DynamoDB table to track object metadata, and that table keeps billing you indefinitely. If you inherited an EMR estate, check for it — turning it off and deleting the table is a small, free cost saving. If a search result recommends enabling it today, treat everything else on that page as suspect too.
S3 503 Slow Down is a prefix problem, not a retry problem
Amazon S3 supports roughly 3,500 write and 5,500 read requests per second per prefix. The words "per prefix" are the whole answer.
Raising fs.s3.maxRetries above its default of 15 makes the client wait longer for the same saturated prefix. The real fixes:
- Spread writes across prefixes. A partition layout that concentrates every write under one date prefix will throttle no matter how many retries you allow.
- Reduce output partitions with
coalesce()orrepartition()before writing — fewer, larger files means fewer PUT requests. (This is the same lever as the small files problem.) - Switch to the AIMD retry strategy, available on EMR 6.4.0 and later. It adapts the request rate from recent successes rather than backing off blindly, and helps most on large clusters. It is not the default — you have to opt in.
The release-label clock nobody sets a reminder for
AWS gives each EMR release 24 months of standard support, then 12 months of end of support, then end of life. The policy was announced on 25 July 2024.
| Phase | Duration | What you lose |
|---|---|---|
| Standard support | 24 months | — full patches and support cases |
| End of support | +12 months | Cannot open support cases; no patches |
| End of life | after that | AWS may remove API/SDK access at its discretion |
Amazon EMR release 7.2.0 entered end of support on 25 July 2026 and reaches end of life on 25 July 2027. If your Terraform or CloudFormation pins emr-7.2.0, you are already in the unsupported window — a support case on a production incident will be declined.
All releases from on or before 24 July 2022 are formally in end of support. Audit your pinned release labels the same way you audit any other dependency, because unlike a library, this one degrades on a calendar rather than on a change you made.
If you are weighing whether to stay on EMR at all, our Databricks vs AWS EMR comparison covers the operational trade-off — and the failure surface differs sharply, as our guide to diagnosing a failed Databricks job shows.
Common mistakes that keep EMR clusters failing
- Not setting an S3 log URI at cluster creation. It cannot be added afterwards, and a terminated cluster takes its local logs with it.
- Concluding logs are missing before five minutes have passed. They upload on a timer.
- Reading Spark logs for a bootstrap failure. Your code never ran.
- Running core nodes on spot. Losing a core node loses HDFS data.
- Disabling the vmem check. You removed the detector, node-wide.
- Raising
memoryOverheadpast the NodeManager ceiling. Turns a crash into an indefiniteACCEPTEDhang. - Using a single fixed instance type. Instance fleets remove most capacity failures for free.
- Leaving EMRFS consistent view on. Obsolete since 2020, and still billing you for DynamoDB.
- Never auditing pinned release labels. Support expires on a date, not on an event.
Frequently Asked Questions
Why does my EMR cluster say "Terminated with errors"?
It means the cluster stopped before completing normally, and the state change reason names the stage that failed. The four possibilities are provisioning, bootstrap, a step failure, and an internal or validation error. Each writes to a different log path, so read the reason first — it decides which log is worth opening and saves you from debugging code that never ran.
Where are EMR logs stored?
EMR writes logs locally on the primary node under /mnt/var/log, and copies them to your S3 log URI if you enabled logging at cluster creation. Under that prefix, bootstrap failures live in node/, step failures in steps/, and executor errors in containers/. Logs upload every five minutes, so allow that delay before concluding one is missing.
How do I fix "Container killed by YARN for exceeding memory limits"?
Raise spark.executor.memoryOverhead, which defaults to the greater of 10% of executor memory or 384 MB. Do not disable yarn.nodemanager.vmem-check-enabled despite the error message suggesting it — that removes the detector, not the problem. Keep executor memory plus overhead below yarn.nodemanager.resource.memory-mb, or containers become unschedulable and the job hangs in ACCEPTED.
Should I enable EMRFS consistent view?
No. Amazon S3 gained strong read-after-write consistency on 1 December 2020, making it redundant, and it reached end of standard support on 1 June 2023. Any guide recommending it as a fix for FileNotFoundException is out of date. It also provisions a DynamoDB table that keeps billing you, so disabling it and deleting that table is a cost saving too.
How do I fix S3 503 "Slow Down" errors on EMR?
S3 allows roughly 3,500 write and 5,500 read requests per second per prefix, so a 503 means one prefix is saturated. Raising fs.s3.maxRetries above its default of 15 only makes the client wait longer. Spread writes across more prefixes, reduce output partitions with coalesce() or repartition(), and on EMR 6.4.0+ consider the AIMD retry strategy.
Why did my EMR bootstrap action fail?
Because the script could not be downloaded, could not be found, or exited non-zero. EMR terminates any instance whose bootstrap action fails and deletes the cluster if too many fail. The usual causes are the EC2 instance profile lacking S3 read permission, a moved script path, and Windows line endings making the script unexecutable.
How long does AWS support an EMR release version?
Under the policy announced 25 July 2024, each release gets 24 months of standard support, then 12 months of end of support with no support cases, then end of life when AWS may remove API and SDK access. Release 7.2.0 entered end of support on 25 July 2026 and reaches end of life on 25 July 2027.
Conclusion
EMR troubleshooting feels harder than it is because one status string covers four unrelated failures. Fix that first: read the termination reason, let it choose your log, and never read an application stack trace for a cluster that failed before RUNNING.
Then unlearn the three fixes that the search results will keep pushing at you. EMRFS consistent view has been redundant since December 2020 and is quietly billing you for a DynamoDB table. Disabling the vmem check removes a detector for every application on the node. Raising fs.s3.maxRetries makes you wait longer on a prefix that is already saturated.
And put your EMR release labels on the same audit schedule as your dependencies — 7.2.0 has been out of standard support since July 2026, and that clock runs whether or not anyone is watching it.
At SolutionGigs we write these from production pipelines rather than documentation summaries. Size your cluster before the next failure with our free Spark Config Optimizer, or browse the rest of our data engineering guides.
Still staring at a cluster that won't start, or a step that fails with nothing useful in the logs? EMR buries the real error one layer below the one it shows you. Send me the failure and the log bundle — I'll tell you which layer it's coming from, and diagnosis costs nothing.
Mohammed Yaseen
Founder, SolutionGigs
Mohammed runs Spark workloads on EMR and Databricks in production, and has read enough stderr.gz files to know that the log you need is rarely the one the console opens by default. LinkedIn →
Try Free Spark Config Optimizer
Free, no signup — right in your browser.
Try Free Spark Config Optimizer →More in Data Engineering
Spark Out of Memory Errors: Causes and Fixes
A Spark out of memory error is a diagnosis problem before it's a config problem — the same OutOfMemoryError can mean data skew, an overflowing off-heap region, or a collect() that dragged a billion rows into the driver. Learn to tell driver OOM from executor OOM, read the exact error message, and fix it with the right knob — partitions, memoryOverhead, or executor memory — with real PySpark code.
Spark Executor Tuning: Cores, Memory & How Many Executors
Ask three data engineers how to size a Spark cluster and you'll get three answers — and usually a job that crawls or dies with 'Container killed for exceeding memory limits.' This guide replaces the guesswork with four arithmetic steps: how many cores per executor (and why 5), how much memory, how to calculate the executor count, plus memoryOverhead, fat vs thin executors, dynamic allocation, and a fully worked sizing example you can copy.
Capstone: Build an End-to-End Data Pipeline
A capstone project to build an end-to-end data pipeline — ingest, store, transform, model, orchestrate, and serve — tying together SQL, Python, Spark, modeling, and Airflow.