
Capstone: Build an End-to-End Data Pipeline
A capstone project to build an end-to-end data pipeline — ingest, store, transform, model, orchestrate, and serve — tying together SQL, Python, Spark, modeling, and Airflow.

📚 The capstone of our free Learn Data Engineering course. This project ties together every track — SQL, Python, modeling, Spark, and orchestration — into one working pipeline.
Quick Answer: An end-to-end data pipeline takes raw data from a source all the way to usable insight through six connected stages: ingest → store → transform → model → orchestrate → serve. In this capstone you'll build one: pull data from an API with Python, land it as Parquet, clean and reshape it, model it into a star schema, orchestrate the whole run with Airflow on a schedule, and serve the result. Every skill from this course, assembled into one project — the thing that makes you a data engineer, not just someone who knows the pieces.
You've learned the parts. This is where they become a whole. A data engineer isn't defined by knowing SQL or Spark in isolation — it's the ability to connect ingestion, storage, transformation, modeling, orchestration, and serving into one reliable flow. This capstone gives you the blueprint and the code skeleton to build exactly that, so you finish the course with a real project, not just knowledge.
The pipeline you'll build
You'll build a pipeline that ingests raw data, cleans and models it, runs on a schedule, and serves analytics — every stage mapped to a track you've completed. Here's the full flow:
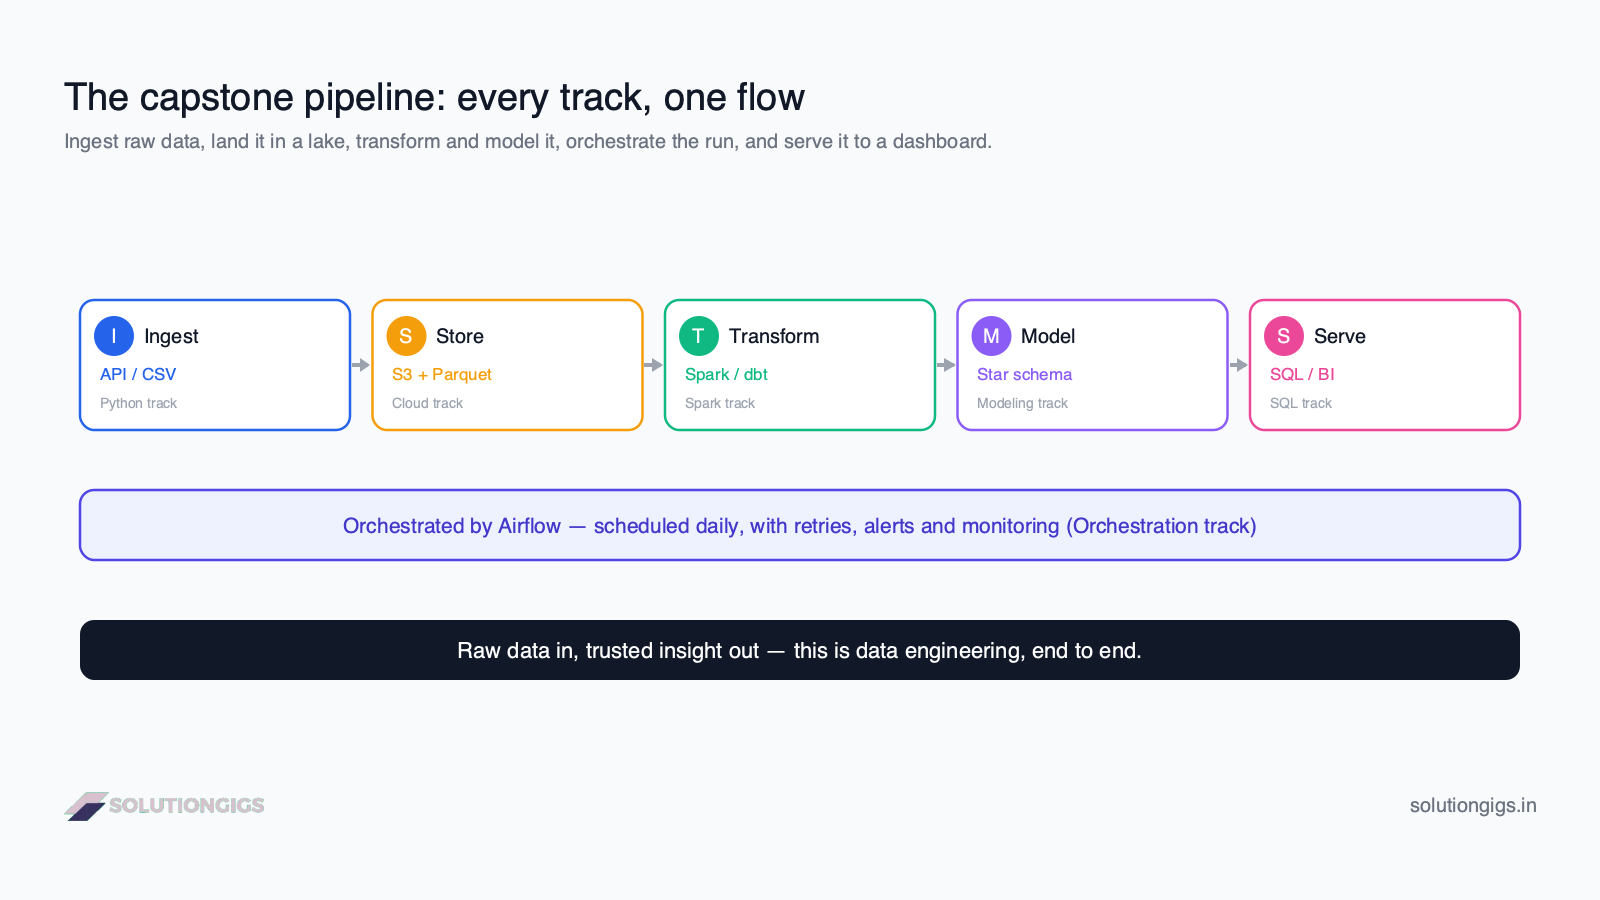
| Stage | What it does | Track it uses |
|---|---|---|
| 1. Ingest | Pull raw data from an API/file | Python |
| 2. Store | Land it as Parquet in a lake | Cloud / AWS |
| 3. Transform | Clean and reshape it | Spark / ETL |
| 4. Model | Build a star schema | Modeling |
| 5. Orchestrate | Schedule + retry the run | Airflow |
| 6. Serve | Query with SQL / BI | SQL |
Pick any public dataset you like — a weather API, a public transit feed, GitHub events, cryptocurrency prices. The domain doesn't matter; the pattern is what you're practicing.
Stage 1 — Ingest
Ingestion pulls raw data from its source and lands it untouched. Following the reading files and APIs lesson, keep extract dumb — just get the data:
import requests, pandas as pd

def ingest(url: str) -> pd.DataFrame:
    """Pull raw records from a public API."""
    resp = requests.get(url, timeout=30)
    resp.raise_for_status()
    return pd.json_normalize(resp.json()["records"])
Save the raw pull before doing anything else — raw data is your source of truth and your ability to reprocess.
Stage 2 — Store
Store raw and curated data as Parquet, organized into zones. Whether locally or in S3, use a raw → curated layout so quality improves as data flows:
def store_raw(df: pd.DataFrame, path: str) -> None:
    df.to_parquet(path, index=False)   # e.g. s3://lake/raw/events/2026-07-08.parquet
Parquet is columnar and compressed — far better than CSV for analytics, and the format every engine (Spark, Athena, warehouses) reads efficiently.
The stage most tutorials skip: register the table somewhere
A file in a bucket is not a dataset — it becomes one when a catalog knows its name, schema and owner. Skipping this is why so many "finished" pipelines are unusable by anyone but their author: nobody else can find the table, nobody knows who may read it, and nothing records where the numbers came from.
Pick a catalog at build time, not after the first audit request:
| If you run on | Register with | Address looks like |
|---|---|---|
| Databricks | Unity Catalog | catalog.schema.table |
| AWS, open engines | AWS Glue Data Catalog or an Iceberg REST catalog | database.table |
| Local / learning | A metadata file plus a README is enough |
— |
The choice is not just plumbing. On Databricks it decides who can read the table, whether lineage is captured for free, and whether the pipeline's files are owned by the catalog or by you — the difference between managed and external tables, covered in Databricks Unity Catalog explained. On open engines the equivalent decision is which Iceberg catalog you point at, compared in Iceberg catalogs compared.
Stage 3 — Transform
Transform cleans, types, and reshapes the raw data into something trustworthy. This is the ETL transform step — use pandas for smaller data, Spark when it's large:
def transform(df: pd.DataFrame) -> pd.DataFrame:
    df = df.copy()
    df = df.dropna(subset=["id", "event_time"])       # drop unusable rows
    df["event_time"] = pd.to_datetime(df["event_time"])
    df["amount"] = df["amount"].astype("float64")
    df["day"] = df["event_time"].dt.date               # derive a partition column
    return df
Keep the transform pure (operate on a copy) so it's easy to test with a small sample.
Stage 4 — Model
Model the clean data into fact and dimension tables — a star schema. Split events (facts) from context (dimensions):
# fact: one row per event, measures + keys
fct_events = clean[["event_id", "day", "user_id", "amount"]]

# dimension: descriptive context, deduplicated
dim_user = clean[["user_id", "country", "segment"]].drop_duplicates()
If a dimension's attributes change over time, apply SCD Type 2 to preserve history. Now the data is analytics-ready: aggregate the facts, filter by the dimensions.
Stage 5 — Orchestrate
Wrap every stage in an Airflow DAG so it runs in order, on a schedule, with retries. This is what turns a set of scripts into a pipeline:
from airflow import DAG
from airflow.operators.python import PythonOperator
from datetime import datetime

with DAG("daily_events", schedule="@daily",
         start_date=datetime(2026, 1, 1), catchup=False,
         default_args={"retries": 2}) as dag:

    t_ingest    = PythonOperator(task_id="ingest",    python_callable=run_ingest)
    t_transform = PythonOperator(task_id="transform", python_callable=run_transform)
    t_model     = PythonOperator(task_id="model",     python_callable=run_model)
    t_publish   = PythonOperator(task_id="publish",   python_callable=run_publish)

    t_ingest >> t_transform >> t_model >> t_publish
Now the pipeline runs itself every day, retries transient failures, and tells you when something breaks.
Stage 6 — Serve
Serve the modeled data to whoever needs it — SQL, a dashboard, or an ML job. With a clean star schema, answering business questions is a simple join and aggregate:
-- daily revenue by country
SELECT u.country, f.day, SUM(f.amount) AS revenue
FROM   fct_events f
JOIN   dim_user   u ON f.user_id = u.user_id
GROUP  BY u.country, f.day
ORDER  BY f.day, revenue DESC;
Point a BI tool (or even a notebook) at this and you've closed the loop: raw data in, insight out.
Make it production-grade
A capstone becomes portfolio-worthy when it's observable, tested, and idempotent — the habits from the ETL lesson:
- Idempotency — overwrite partitions by day so re-runs don't duplicate data.
- Logging — log row counts at each stage so you can see what happened.
- Data quality checks — assert row counts and non-null keys before publishing.
- Version control — put the whole thing in Git; add a README explaining the flow.
These are the details that make a hiring manager take the project seriously.
Try it yourself — the capstone challenge
Build your own version. A minimum checklist to call it complete:
- Ingests from a real public API or dataset with Python.
- Stores raw and curated data as Parquet.
- Has a transform step that cleans and types the data.
- Produces at least one fact and one dimension table (a star schema).
- Is orchestrated by an Airflow DAG on a schedule, with retries.
- Serves at least one useful SQL query or dashboard.
Show a suggested project idea
Public transit pipeline: ingest a city's open transit API (vehicle positions or trip updates), store raw JSON→Parquet daily, transform into clean trip events, model fct_trips + dim_route + dim_stop, orchestrate a daily Airflow DAG, and serve a "trips and average delay by route" query. It touches every stage, uses genuinely messy real-world data, and makes a great portfolio piece.
Common mistakes in an end-to-end pipeline
- Building it as one giant script. Separate the stages (ingest/transform/model/serve) so each is testable and reusable.
- Skipping orchestration. A pipeline that only runs when you run it by hand isn't finished — schedule it with Airflow.
- No idempotency. Re-running duplicates data. Overwrite by partition so re-runs are safe.
- Modeling as an afterthought. Dumping wide, messy tables makes serving painful. Model a proper star schema.
- No documentation. For a portfolio project, a clear README with the architecture diagram is half the value.
Frequently Asked Questions
What is an end-to-end data pipeline?
An end-to-end data pipeline is a complete flow from raw source data to usable insight. It ingests data from an API, file, or database; stores it in a lake or warehouse; transforms and cleans it; models it into analytics-ready tables; runs on a schedule with retries (orchestration); and serves the result to a dashboard or ML model. "End-to-end" means every stage is connected, automated, and reliable.
What are the stages of a data pipeline?
Six stages: ingest (pull data from sources), store (land it in a lake or warehouse), transform (clean and reshape), model (structure into fact and dimension tables), orchestrate (schedule and connect the steps with retries), and serve (deliver to BI, dashboards, or ML). Data flows through in order, and orchestration ties them into one automated run.
What is a good capstone project for data engineering?
An end-to-end pipeline you build yourself: pick a public API or dataset, ingest it with Python, store raw data as Parquet, transform with pandas or Spark, model it into a star schema, orchestrate with Airflow on a daily schedule, and serve the result in a dashboard or SQL. It demonstrates SQL, Python, modeling, and orchestration in one connected project.
How do I build a data pipeline from scratch?
Start small and connect one stage at a time. Write a Python script that ingests and saves data. Add a transform step that cleans it. Model the output into fact and dimension tables. Wrap the steps in an Airflow DAG so they run in order on a schedule with retries. Finally, point a dashboard or SQL query at the result. Build incrementally, testing each stage first.
What skills do you need to build a data pipeline?
SQL for querying and transforming, Python for ingestion and logic, data modeling (fact and dimension tables) so output is analytics-ready, and orchestration with Airflow to schedule the steps reliably. For larger data, add Spark and a cloud platform like AWS. These are exactly the skills the Learn Data Engineering course builds, track by track.
Conclusion
An end-to-end data pipeline — ingest, store, transform, model, orchestrate, serve — is data engineering in one project, and building one is how everything you've learned clicks into place. Take a public dataset, connect the six stages, orchestrate it with Airflow, and make it idempotent and observable. Put it on GitHub with the architecture diagram, and you have a portfolio project that proves you can do the whole job, not just the pieces.
That completes the free Learn Data Engineering course — from "what is data engineering?" to a working end-to-end pipeline. You've built real, job-ready skills. For turning them into a job — the entry paths, a six-month plan and the portfolio bar reviewers actually apply — see how to become a data engineer. Need one of these standing up against a deadline rather than as a learning exercise? /services returns a scope and a fixed price within one business day.
Mohammed Yaseen
Founder, SolutionGigs
Mohammed builds end-to-end data pipelines in production and created the free Learn Data Engineering course to teach the whole journey — from first query to shipped pipeline. LinkedIn →
More in Data Engineering
How Data Flows Through a Data Engineering Pipeline
Follow one checkout event as it flows through a data engineering pipeline — source, ingest, lake, transform, model, and serve — changing shape at every stage until it is a number on a dashboard.
Batch vs Streaming: Architecture, Latency Tradeoffs & Decision Rules
Batch vs streaming data processing explained — the real differences, latency and cost trade-offs, micro-batching, and a decision framework for when to choose each in 2026.
Data Engineering on AWS: S3, EMR & Glue
Data engineering on AWS explained — how S3, Glue, EMR, Athena, and Redshift fit together into a data pipeline, what each service does, and when to use which.