
How Data Flows Through a Data Engineering Pipeline
Follow one checkout event as it flows through a data engineering pipeline — source, ingest, lake, transform, model, and serve — changing shape at every stage until it is a number on a dashboard.

Quick Answer: In a data engineering pipeline, data flows through six stages — source → ingest → lake → transform → model → serve — and at each one, the same piece of data changes shape. A checkout click starts life as a messy JSON event, lands raw in a data lake, gets cleaned and typed, is reshaped into an analytics table, and ends as a single number on a revenue dashboard. Data engineering is the craft of making that flow happen reliably, on schedule, for billions of events — not once, but every day.
Most explanations of data engineering hand you a diagram of boxes and arrows and leave it at that. This one is different: we're going to follow one event — a single customer clicking "Buy" — and watch it flow through the entire pipeline, changing form at every step, until it becomes something a CEO reads off a dashboard. By the end, the whole discipline will feel like what it actually is: a river of data, and the engineering that keeps it flowing.
The event is born
Every pipeline starts with a source — the moment data is created. At 9:14 a.m., a customer in Pune taps "Buy" on a ₹1,299 order. In that instant, the application emits an event:
{"event": "checkout", "order_id": "A8F3", "amount": 1299, "user": 42, "ts": "2026-07-08T09:14:03Z"}
That little JSON blob is where our journey begins. It's raw, unstructured, and completely useless for analytics in its current form — but it's true. It captured something real that happened. The entire job of the pipeline is to carry this truth downstream and turn it into insight, without losing or corrupting it along the way.
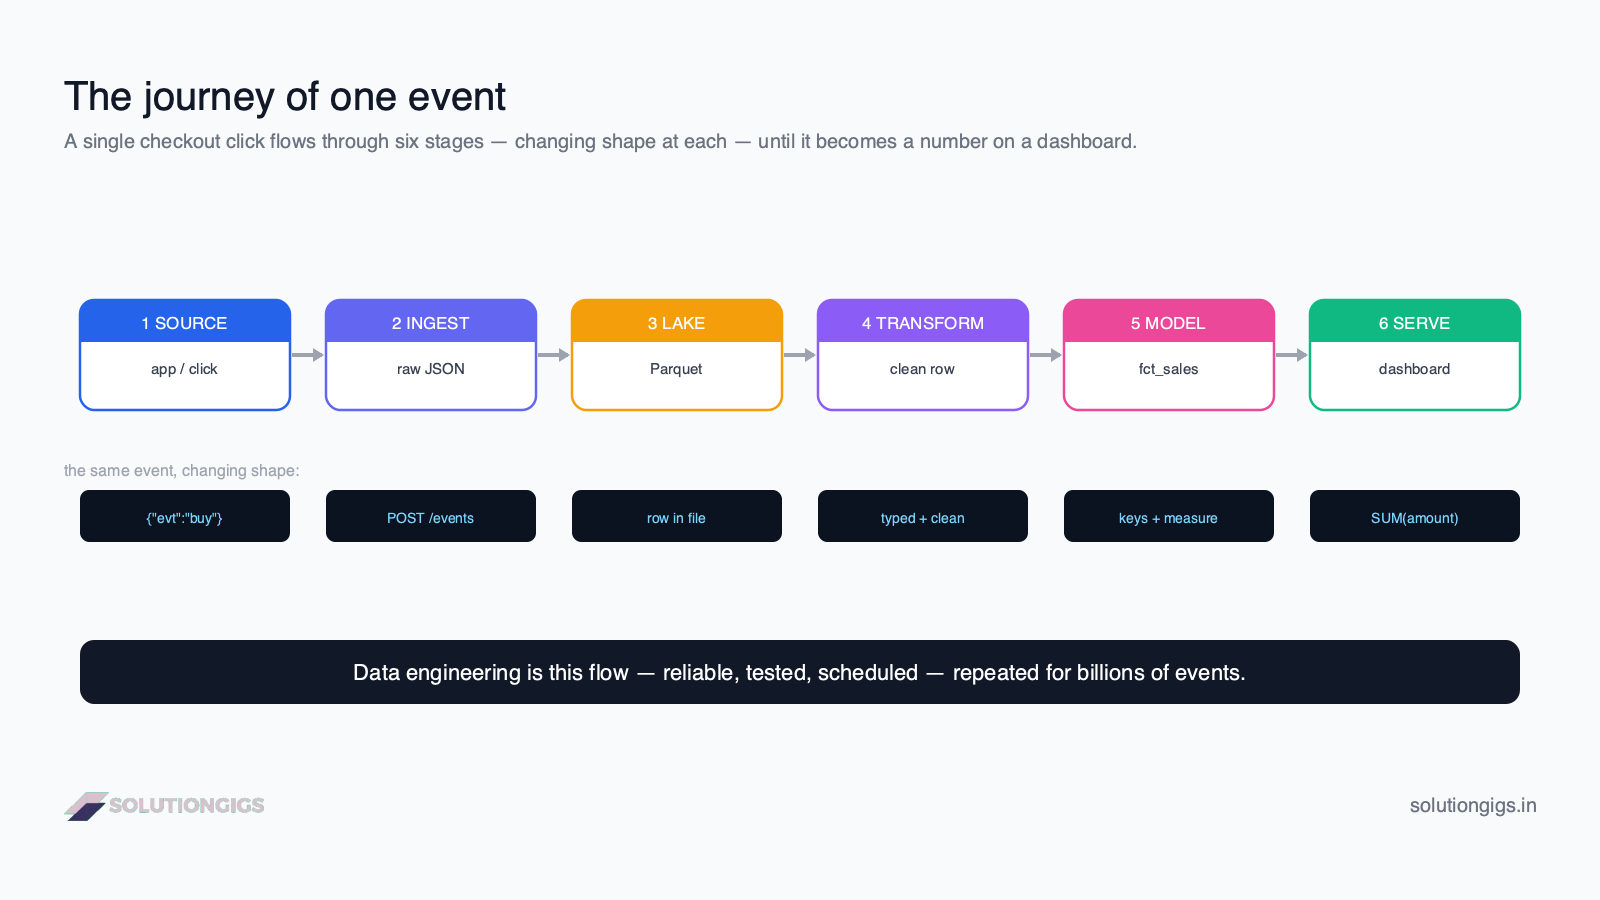
The diagram above is our map. Watch the bottom row: it's the same event, changing shape at each stage. That transformation is the whole story.
Stage 1 → 2: Ingestion carries it in
Ingestion moves the event from where it was born into the data platform. Our checkout event doesn't magically appear in a warehouse — something has to carry it there. That something is the ingestion layer.
For a high-volume stream of clicks, the event is published to Apache Kafka, landing in a checkout topic where it waits patiently on a partition until a consumer picks it up. For slower, batch sources, an ingestion tool like Fivetran or a Python script hitting an API pulls the data on a schedule.
The golden rule here: ingest, don't transform. The event arrives raw and untouched. Resist the urge to clean it now — that's a later stage's job, and mixing the two makes the pipeline fragile.
This is also where the batch vs streaming decision bites. Our checkout event could flow through in real time (streaming) or be scooped up with thousands of others every hour (batch). Most companies do the latter unless the business genuinely needs to act on the event within seconds.
Stage 3: It lands in the lake
The event comes to rest — raw and durable — in the data lake. Our JSON blob, along with millions of its siblings, is written to cheap object storage (like Amazon S3) as a Parquet file:
s3://lake/raw/checkout/2026-07-08/events.parquet
Why store it raw first? Because raw data is your source of truth. If a bug corrupts a downstream table, you can always reprocess from the lake. Parquet — columnar and compressed — makes this cheap to store and fast to read later. Our event is now one row among millions, sitting in the raw zone, waiting for the current to carry it onward.
At this point the data has changed shape once: from a live JSON event to a row in a file. It's still messy, but now it's durable and queryable.
Stage 4: Transformation cleans the current
Transformation is where the raw event becomes trustworthy. A scheduled job — pandas for smaller data, Spark when it's huge — reads the raw rows and reshapes them:
df = df.dropna(subset=["order_id", "amount"])   # drop broken rows
df = df[df["amount"] > 0]                        # remove bad amounts
df["amount"] = df["amount"].astype("float64")    # enforce type
df["ts"] = pd.to_datetime(df["ts"])              # parse the timestamp
Our checkout event, once a loose bag of strings, is now a clean, typed, validated record. The amount is a real number. The timestamp is a real datetime. Broken sibling events have been filtered out. This is the stage that separates "some data we collected" from "data we can trust" — the ETL transform step in action.
Stage 5: Modeling gives it meaning
Modeling reshapes the clean record into the analytics-ready structure of a warehouse. A single flat table is fine for one event, but analysts don't ask "show me event A8F3" — they ask "what was revenue by city last quarter?" To answer that fast, the data is split into a star schema: a fact table of measurable events, and dimension tables of context.
Our event flows into the fct_sales fact table as a row of keys and measures:
| order_id | user_key | date_key | amount |
|---|---|---|---|
| A8F3 | 42 | 20260708 | 1299.00 |
The who (user 42's city, segment) lives in dim_user; the when lives in dim_date. Our event is now a citizen of a well-organized warehouse, ready to be joined and aggregated. If user 42 later moves cities, SCD Type 2 makes sure this sale still counts for Pune, where it actually happened.
Stage 6: It becomes insight
Finally, the event is served — aggregated into the answer someone actually wanted. A dashboard runs a query:
SELECT u.city, SUM(f.amount) AS revenue
FROM   fct_sales f
JOIN   dim_user  u ON f.user_key = u.user_key
WHERE  f.date_key = 20260708
GROUP  BY u.city;
And our ₹1,299 checkout — born as a JSON blob at 9:14 a.m. — becomes part of a single number: "Pune: ₹4.2L today." The CEO glances at it over coffee and never once thinks about the river of engineering that carried one click across six stages to land on that screen. That invisibility is the mark of a pipeline done right.
Stage 6b: Or it becomes an answer
A dashboard is no longer the only place the river ends. Increasingly the same curated tables and the company's documents feed a retrieval layer that an AI assistant queries at runtime, and that destination changes the requirements upstream.
A dashboard has a human reading it who notices when revenue looks wrong by a factor of three. An assistant does not — it phrases the wrong number beautifully. So when the flow ends in an answer rather than a chart, three things have to travel the whole river with the data: what one row means (the grain), who is allowed to see it (permission metadata), and how stale it is allowed to be. Those requirements are unpacked in AI and data engineering.
What keeps the river flowing
The flow only matters if it happens reliably, every single day — and that's orchestration's job. Everything above is a set of steps. What turns steps into a pipeline is an orchestrator like Apache Airflow, running the whole flow as a scheduled DAG:
ingest >> land_in_lake >> transform >> model >> publish
Airflow runs the stages in order, retries the one that failed at 3 a.m., and alerts an engineer if the river ever stops. Add idempotency (safe re-runs), logging (so you can see the flow), and data-quality checks (so bad data never reaches the dashboard), and you have a pipeline that flows correctly for one event or for a billion.
That's the real definition of the job: data engineering is keeping this flow reliable at scale. Anyone can move one event once. An engineer makes it happen every day, correctly, without anyone noticing.
Try it yourself — trace the flow
Test your understanding of the journey:
- At which stage does our raw JSON event first become a typed, validated record?
- Why is the event stored raw in the lake before it's transformed?
- Which component is responsible for retrying a failed stage and alerting an engineer?
Show answers
- Stage 4 — Transformation. That's where types are enforced (
amount→ float,ts→ datetime) and broken rows are dropped. - Because raw data is the source of truth. If a downstream table gets corrupted by a bug, you can reprocess from the untouched raw data in the lake. Transforming before storing would lose that safety net.
- The orchestrator (Apache Airflow) — it schedules the flow, retries failed stages, and sends alerts on failure.
Common ways the flow breaks
- Transforming during ingestion. Cleaning data as it comes in couples two jobs and makes the pipeline brittle — ingest raw, transform later.
- No raw zone. Skipping the lake and writing straight to the warehouse means a bug downstream can't be recovered — you've lost the source of truth.
- Blind appends. Re-running a stage that appends duplicates the flow. Overwrite or upsert by partition so re-runs are safe (idempotency).
- No orchestration. Disconnected cron jobs with no dependencies or retries means the river silently stops and nobody notices until a dashboard is wrong.
- Serving un-modeled data. Pointing dashboards at wide, messy tables makes every query slow and error-prone — model a star schema first.
Frequently Asked Questions
How does data flow through a data engineering pipeline?
Through six stages: it's created at a source, ingested into the platform, stored raw in a data lake, transformed into clean typed records, modeled into fact and dimension tables, and served to dashboards or ML. At each stage the same data changes shape — from raw JSON to a dashboard number — while an orchestrator runs the whole flow reliably on a schedule.
What are the stages of data flow in data engineering?
Source (where data is created), ingest (moving it into the platform), lake (durable raw storage as Parquet), transform (cleaning and typing), model (structuring into fact and dimension tables), and serve (delivering to BI, dashboards, or ML). Data moves through them in order, tied together by orchestration into one automated run.
What is the difference between a data lake and a data warehouse in this flow?
The lake holds raw, unprocessed data cheaply at scale — where events land untouched as Parquet. The warehouse holds clean, modeled, query-optimized tables that dashboards read. Data lands raw in the lake first; transformation and modeling then produce the trustworthy tables in the warehouse. Lake is the staging ground; warehouse is the finished product.
Why does data change shape as it flows through a pipeline?
Because each stage has a different job. Raw source data is messy and unqueryable; transformation cleans and types it; modeling reshapes it into analytics-optimized tables; serving aggregates it into the exact numbers a dashboard needs. The same checkout event starts as raw JSON and ends as a contribution to a revenue total.
What keeps a data pipeline flowing reliably?
An orchestrator like Apache Airflow. It schedules the pipeline, runs stages in order, retries failures, and alerts engineers when something breaks. Combined with idempotency, logging, and data-quality checks, orchestration turns a set of scripts into a dependable pipeline that flows correctly every day, for billions of events.
Conclusion
A data engineering pipeline is a river: one checkout click flows through source, ingest, lake, transform, model, and serve — changing shape at every bend — until it surfaces as a number someone makes a decision on. Understand that flow and the whole discipline snaps into focus. Every tool you'll ever learn — Kafka, Spark, dbt, Airflow, a warehouse — is just something that operates on one stretch of this river, keeping the water clean and moving.
Want to actually build each stage of this flow, hands-on? That's exactly what the free Learn Data Engineering course does — from your first SQL query to a full end-to-end pipeline. And when you need a real one shipped against a deadline, tell us what you're moving — source to table to dashboard, scoped and priced within one business day.
Mohammed Yaseen
Founder, SolutionGigs
Mohammed builds the pipelines that keep data flowing — from Kafka ingestion to Spark transforms to served dashboards — and teaches the whole flow in the free Learn Data Engineering course. LinkedIn →
More in Data Engineering
Capstone: Build an End-to-End Data Pipeline
A capstone project to build an end-to-end data pipeline — ingest, store, transform, model, orchestrate, and serve — tying together SQL, Python, Spark, modeling, and Airflow.
What Is Data Engineering? The Role Explained
What is data engineering? A clear explanation of the role — what a data engineer does day to day, the tools they use, how it differs from data science and analytics, and how to start.
Data Engineering on AWS: S3, EMR & Glue
Data engineering on AWS explained — how S3, Glue, EMR, Athena, and Redshift fit together into a data pipeline, what each service does, and when to use which.