
pandas Tutorial for Data Engineering: The Essentials
A pandas tutorial for data engineering — load, inspect, select, filter, and aggregate data in Python, mapped directly to the SQL you already know, with runnable examples.

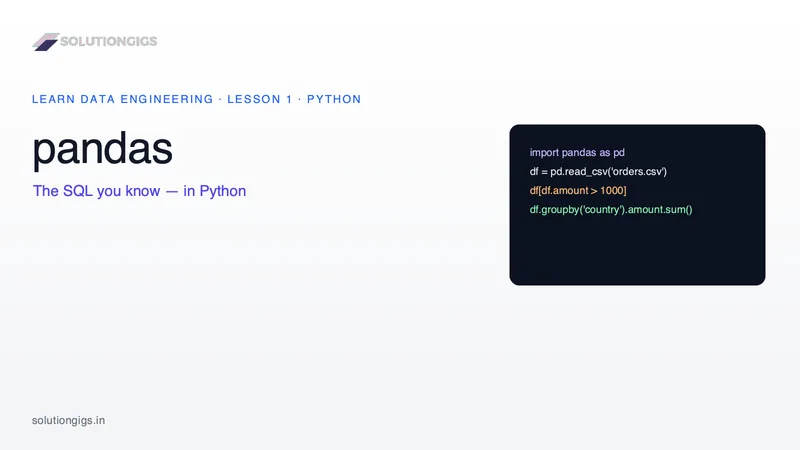
📚 Lesson 1 of the Python track in our free Learn Data Engineering course. Just finished the SQL track? You'll feel right at home — pandas is SQL's Python twin.
Quick Answer: pandas is the Python library for working with tabular data. Its core object is the DataFrame — a table with named columns and a row index. You read_csv() to load data, then select columns with df[['col']], filter rows with a boolean mask df[df.amount > 100], aggregate with df.groupby('country')['amount'].sum(), and sort with sort_values(). If you know SQL, you already know pandas — the concepts map almost one-to-one.
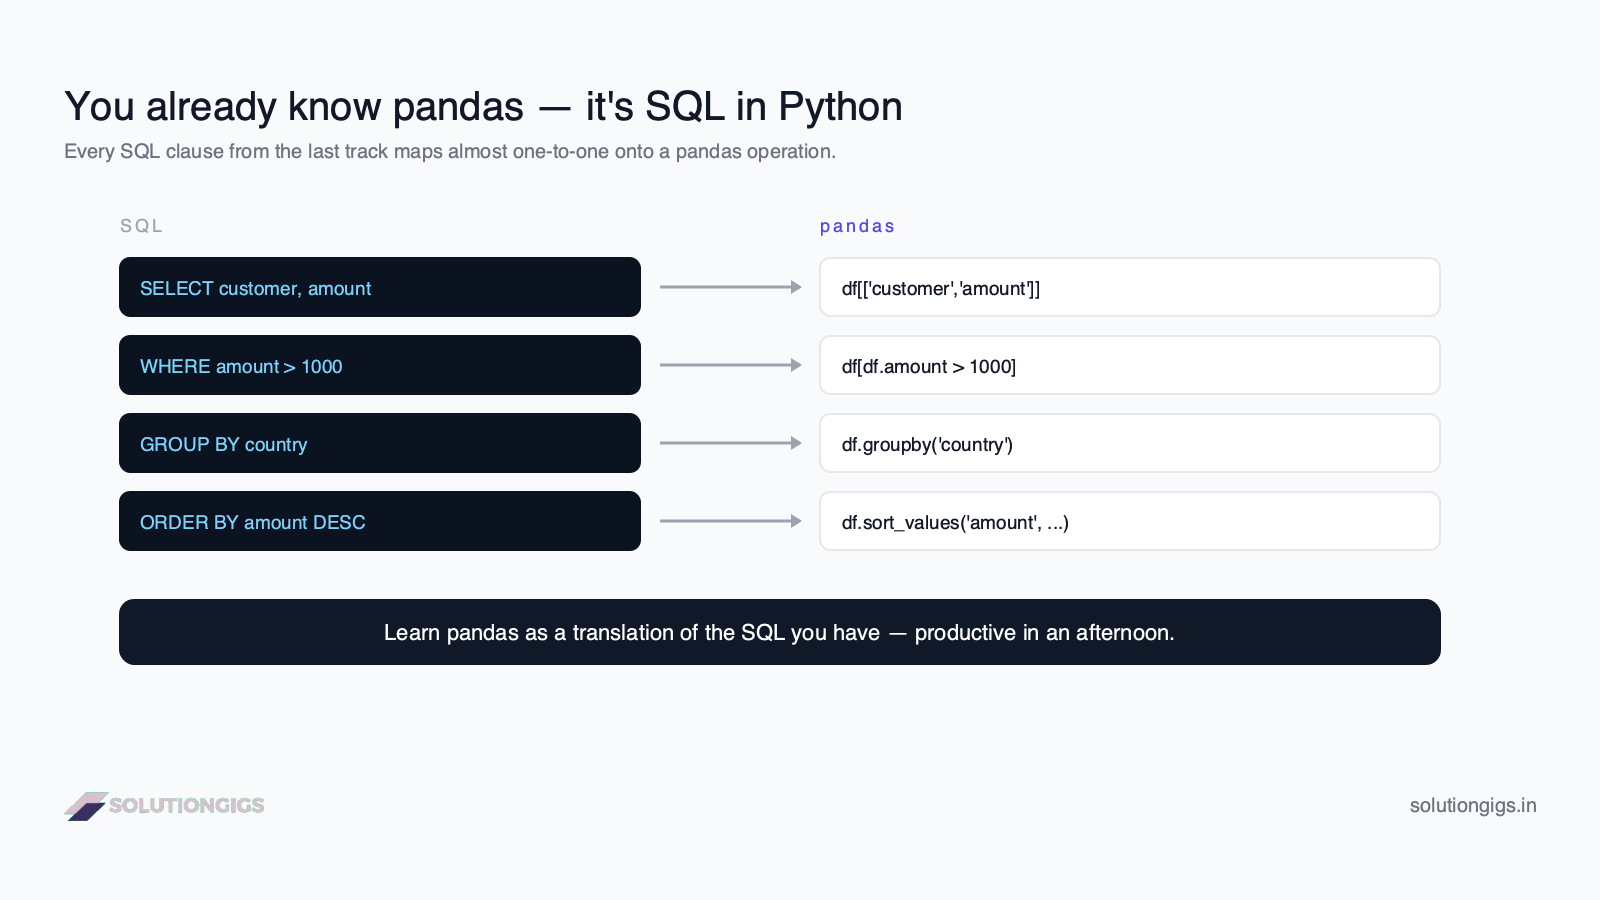
Here's the shortcut most tutorials miss: you just learned SQL, and pandas does the same things with different syntax. SELECT becomes df[[...]], WHERE becomes a boolean mask, GROUP BY becomes .groupby(). So instead of learning pandas from zero, we'll learn it as a translation of the SQL you already have in your head — the fastest way to get productive. By the end you'll load, inspect, filter, and aggregate real data in Python, ready to build actual ETL scripts in the next lessons.
Setup and our dataset
pandas is one pip install pandas away. We'll use the same orders data from the SQL track, now as a CSV:
import pandas as pd

df = pd.read_csv("orders.csv")
# columns: order_id, customer, country, amount, status
pd.read_csv() returns a DataFrame — think of it as a table living in memory. pandas can also read Excel, JSON, Parquet, SQL, and more (we cover files and APIs in the next lesson).
The DataFrame: a table in memory
A DataFrame is a 2-D table with named columns and a labelled row index; each column is a Series with its own data type. Understanding this structure makes everything else click.
Always start by looking at your data:
df.head()        # first 5 rows
df.shape         # (rows, columns) → e.g. (6, 5)
df.info()        # column names, non-null counts, dtypes
df.describe()    # summary stats for numeric columns
df.info() is the single most useful command in data engineering — it tells you row count, data types, and where you have missing (NaN) values, all at once.
SELECT → choosing columns
To pick columns, index the DataFrame with a list of column names — the pandas equivalent of the SELECT list.
# SQL:  SELECT customer, amount FROM orders
df[["customer", "amount"]]
df["amount"](single brackets, one name) returns a Series (one column).df[["amount"]](double brackets) returns a DataFrame (a table). This trips up beginners — use double brackets when you want a table back.
WHERE → filtering rows with a boolean mask
Filtering uses a boolean mask: write a condition, and pandas keeps the rows where it's True. This is WHERE.
# SQL:  SELECT * FROM orders WHERE amount > 1000
df[df["amount"] > 1000]

# SQL:  WHERE status = 'paid' AND amount > 1000
df[(df["status"] == "paid") & (df["amount"] > 1000)]
Two rules that cause 90% of beginner errors:
- Use
&for AND and|for OR (not the Python wordsand/or). - Wrap each condition in parentheses —
(df.status == "paid") & (df.amount > 1000)— because&binds tighter than>.
GROUP BY → aggregating with groupby
df.groupby(col)[agg_col].func() splits rows into groups and aggregates each — identical in meaning to SQL GROUP BY.
# SQL:  SELECT country, SUM(amount) FROM orders GROUP BY country
df.groupby("country")["amount"].sum()

# Multiple aggregates at once
df.groupby("country")["amount"].agg(["count", "sum", "mean"])
That .agg([...]) call is the pandas version of selecting COUNT(*), SUM(), and AVG() together — one line, one result table per country.
ORDER BY → sorting
sort_values() orders rows; it's ORDER BY, ascending by default.
# SQL:  SELECT * FROM orders ORDER BY amount DESC
df.sort_values("amount", ascending=False)

# Sort by multiple columns, each direction
df.sort_values(["country", "amount"], ascending=[True, False])
Creating new columns (what SQL makes harder)
Assigning to a new column name adds a derived column — this is where pandas starts to feel more flexible than SQL.
# add an 18% tax column
df["total"] = df["amount"] * 1.18

# conditional column
import numpy as np
df["tier"] = np.where(df["amount"] > 3000, "high", "standard")
No ALTER TABLE, no subquery — just assign. This ease with row-wise derivations is a big reason data engineers reach for pandas in transformation steps.
The SQL → pandas cheat sheet
| SQL | pandas |
|---|---|
SELECT a, b |
df[["a", "b"]] |
WHERE x > 10 |
df[df["x"] > 10] |
WHERE a AND b |
df[(cond_a) & (cond_b)] |
GROUP BY c + SUM(x) |
df.groupby("c")["x"].sum() |
ORDER BY x DESC |
df.sort_values("x", ascending=False) |
COUNT(*) |
len(df) or df.shape[0] |
SELECT DISTINCT c |
df["c"].unique() |
LIMIT 5 |
df.head(5) |
| new column | df["new"] = ... |
Keep this next to you — it converts almost any simple SQL query into pandas.
Try it yourself — exercises
Assume df is the loaded orders data:
- Return only the
customerandcountrycolumns. - Filter to paid orders over 2000.
- Compute total
amountpercountry, highest first.
Show answers
# 1
df[["customer", "country"]]

# 2
df[(df["status"] == "paid") & (df["amount"] > 2000)]

# 3
df.groupby("country")["amount"].sum().sort_values(ascending=False)
Common mistakes to avoid
- Using
and/orinstead of&/|in filters — raises an error. - Forgetting parentheses around each condition in a compound mask.
- Confusing
df["col"](Series) withdf[["col"]](DataFrame). - Chained assignment like
df[df.x > 1]["y"] = 0— it silently fails; usedf.loc[df.x > 1, "y"] = 0. - Assuming pandas scales like a database. pandas holds data in RAM — for tens of millions of rows, push the work to SQL or Spark instead.
What's next in the Python track
You can now load, filter, and aggregate data in pandas using the SQL you already know. Next in the Learn Data Engineering path: reading from files, APIs, and JSON — getting real, messy data into a DataFrame in the first place, including nested JSON from web APIs.
Frequently Asked Questions
What is pandas used for in data engineering?
pandas loads, cleans, transforms, and analyzes tabular data in memory. In data engineering it powers small-to-medium ETL jobs, data validation, quick exploration, and reshaping data before loading it into a warehouse — doing in Python what SQL does in a database, with more flexibility for messy or nested data.
What is a pandas DataFrame?
A DataFrame is pandas' core structure: a 2-D table with labelled rows (the index) and named columns, like a database table or spreadsheet. Each column is a Series with its own data type. You load data into a DataFrame, then select, filter, and aggregate it with pandas methods.
How is pandas different from SQL?
Both select, filter, group, and sort — but pandas runs in Python memory on a DataFrame while SQL runs in a database. pandas suits messy, nested, or one-off transformations and the Python ecosystem; SQL suits large datasets living in a database. Most data engineers use both, often together.
How do I filter rows in pandas?
Use a boolean mask: df[df["amount"] > 1000] keeps rows where amount exceeds 1000. Combine conditions with & (and) and | (or), wrapping each in parentheses: df[(df["status"] == "paid") & (df["amount"] > 1000)]. It's the pandas equivalent of SQL's WHERE.
What does groupby do in pandas?
groupby splits rows into groups by a column's values, then applies an aggregate like sum, mean, or count to each — exactly like SQL's GROUP BY. For example, df.groupby("country")["amount"].sum() returns the total per country. It's the main way to summarize data in pandas.
Conclusion
pandas is SQL's Python twin: SELECT → df[[...]], WHERE → a boolean mask, GROUP BY → .groupby(), ORDER BY → sort_values(). Learn it as a translation of the SQL you already know and you'll be productive in an afternoon, with the bonus that pandas handles derived columns and messy data more flexibly than SQL. Keep the cheat sheet handy and practice on real CSVs.
This was Lesson 1 of the Python track. Continue the free Learn Data Engineering course into files, APIs, and building real ETL. And when a pandas job starts to feel slow, see Polars vs Pandas — a Rust-powered, multi-core alternative with a similar API that's often 5–50× faster. Ready to ship production pipelines? Get matched with a vetted data engineer on SolutionGigs — it's free to post a project.
Mohammed Yaseen
Founder, SolutionGigs
Mohammed uses pandas daily for transformation and validation steps in production pipelines, and teaches the Python track in the free Learn Data Engineering course. LinkedIn →
More in Data Engineering
SQL Joins Explained: INNER, LEFT, RIGHT & FULL
SQL joins explained with one real dataset — INNER, LEFT, RIGHT, and FULL joins, when to use each, what happens to unmatched rows, common mistakes, and exercises.
SQL SELECT, WHERE & ORDER BY: A Beginner's Guide
Learn SQL SELECT, WHERE, and ORDER BY from scratch — how to query, filter, and sort data — with one real dataset, runnable examples, exercises, and the execution order most beginners get wrong.
SQL Window Functions Explained: ROW_NUMBER, RANK & More
SQL window functions explained simply — ROW_NUMBER, RANK, running totals, and per-group calculations that keep every row. OVER, PARTITION BY, and ORDER BY with real examples.