
Datadog Pricing Explained: Every Product, Every Meter
Datadog pricing explained product by product: per-host, per-GB and per-series meters, allotments, annual vs on-demand rates, and three worked bills. Every price in one table, the billing rules that decide what you are actually charged for (99th-percentile hosts, pooled allotments, hourly custom-metric counts, ingestion vs indexing), three monthly bills you can reproduce in our free calculator, and the five usual suspects behind a surprise invoice.

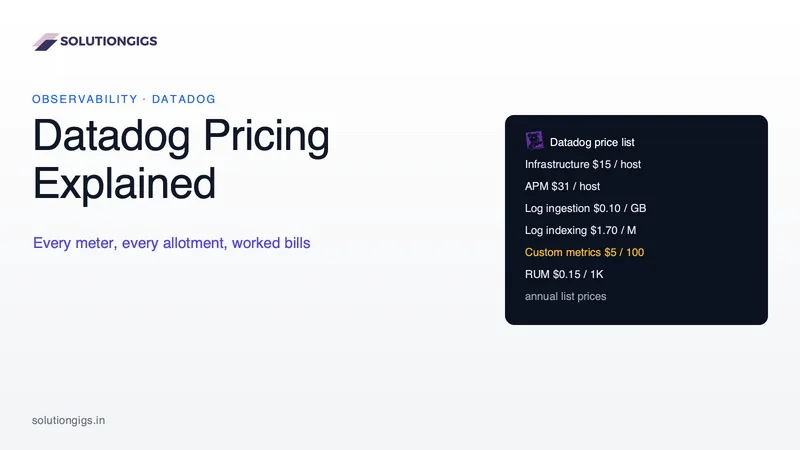
Quick Answer: Datadog pricing is modular: every product has its own meter. Infrastructure monitoring costs $15 per host per month (Pro, annual) or $23 (Enterprise); APM adds $31–$40 per APM host; logs cost $0.10 per GB ingested plus $1.06–$2.50 per million events indexed, depending on retention; custom metrics beyond your allotment cost $5 per 100. Host fees are predictable. The surprises come from custom-metric cardinality and indexed logs, which grow with what your code emits, not with your fleet.
Datadog pricing is famously hard to predict, and not because the prices are hidden. Datadog publishes a full list price page. The difficulty is that a bill is the sum of a dozen independent meters, each with its own unit, allotment and retention tier. Most "Datadog pricing" articles are written by competitors selling a cheaper alternative. This one is not: we use Datadog, and we build observability for data platforms. Below you get every meter in one table, the three rules that decide how each one grows, and three worked monthly bills you can reproduce line by line in our free Datadog pricing calculator.
All prices below are Datadog's public list prices, checked on 6 October 2026. Negotiated contracts and committed-use discounts will lower your real invoice.
How does Datadog pricing work?
Datadog bills each product separately, on one of three kinds of meter: per host, per unit of volume, or per custom-metric series. Your monthly bill is the sum of every product you have switched on, after each product's free allotment is subtracted.
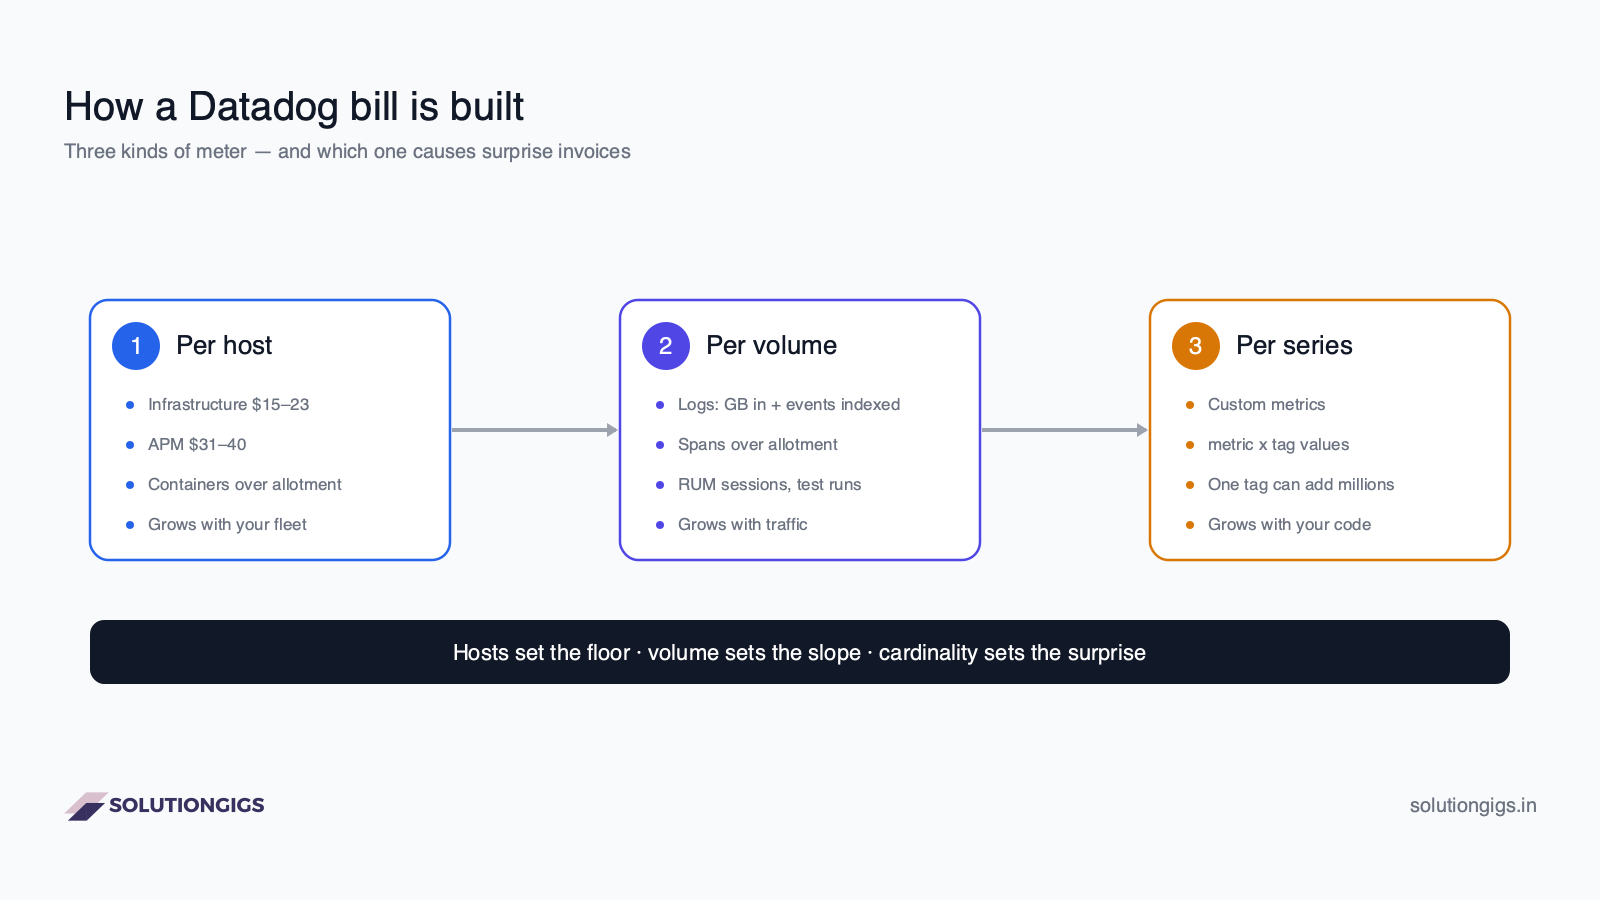
Understanding which kind of meter a product uses tells you how its cost will behave:
- Per host — grows with your fleet. Infrastructure and APM. Add ten servers and you know exactly what you will pay.
- Per volume — grows with your traffic. Log GB and indexed events, spans over the allotment, RUM sessions, synthetic test runs. Double your traffic and these roughly double.
- Per series — grows with your code. Custom metrics. A single new tag on a single metric can multiply this line by a thousand without any change in traffic or hosts. This is where surprise invoices come from.
Datadog price list: every product at a glance
The table below covers the products most teams actually run. "Allotment" is what each host includes before overage starts.
| Product | Unit | Annual | Month-to-month | On-demand | Included allotment |
|---|---|---|---|---|---|
| Infrastructure Pro | per host / month | $15 | $18 | $18 | 5 containers, 100 custom metrics per host |
| Infrastructure Enterprise | per host / month | $23 | $27 | $27 | 10 containers, 200 custom metrics per host |
| Extra containers | per container / month | $1 | $1 | $1 | — |
| Custom metrics | per 100 / month | $5 | $5 | $5 | pooled from host allotments |
| APM | per APM host / month | $31 | $36 | $36 | 1M indexed spans, 150 GB ingested spans |
| APM Pro | per APM host / month | $35 | $42 | $42 | same as APM |
| APM Enterprise | per APM host / month | $40 | $48 | $48 | same as APM |
| Ingested spans (overage) | per GB | $0.10 | $0.10 | $0.10 | — |
| Log ingestion | per GB | $0.10 | $0.10 | $0.10 | — |
| Log indexing, 3-day | per million events | $1.06 | $1.27 | $1.59 | — |
| Log indexing, 7-day | per million events | $1.27 | $1.52 | $1.91 | — |
| Log indexing, 15-day | per million events | $1.70 | $2.04 | $2.55 | — |
| Log indexing, 30-day | per million events | $2.50 | $3.00 | $3.75 | — |
| RUM | per 1,000 sessions | $0.15 | $0.18 | $0.22 | — |
| Session Replay | per 1,000 sessions | $2.50 | $3.00 | $3.60 | — |
| Synthetic API tests | per 10,000 runs | $5 | $6 | $7.20 | — |
| Synthetic browser tests | per 1,000 runs | $12 | $15 | $18 | — |
Indexed spans beyond the APM allotment use the same per-million retention prices as indexed logs (7, 15 or 30 days). There is also a free infrastructure tier for up to 5 hosts with 1-day retention, which is useful for learning but not for production.
The billing rules that decide your real cost
The list price is only half the story. These rules, documented in Datadog's billing docs, decide how many units you are actually charged for.
Hosts are billed on the 99th percentile
Datadog counts your hosts every hour and bills on the 99th percentile of those hourly counts across the month. The top 1% of hours (about 7 hours in a 30-day month) is discarded. A brief autoscaling spike is therefore free, but a fleet that runs at 80 hosts for a full day each week is billed as 80 hosts.
Allotments are pooled across the account
Custom-metric allotments are pooled. Twenty Pro hosts give your whole account 2,000 included custom metrics, not 100 per host that expire individually. Container allotments are averaged in the same way: 20 Pro hosts include 100 containers in total, however they are distributed.
Custom metrics count distinct series, averaged hourly
A custom metric is one unique combination of metric name + tag values. Datadog counts the distinct combinations that report each hour and bills the monthly average. Only combinations that actually report count. This is why user_id is dangerous: every user who generates a data point creates a new billable series. Distribution metrics count more than once, because each one produces several aggregations.
Logs are billed twice: once in, once searchable
Every GB you send pays $0.10 ingestion. Then each million events you keep searchable pays the indexing rate for its retention window. Exclusion filters drop logs from the index, not from ingestion, so excluded logs still cost $0.10 per GB but nothing more. Our Datadog log management guide walks through setting up indexes and exclusion filters.
Three worked Datadog bills
Each of these uses annual list prices. Open the Datadog pricing calculator, enter the same inputs, and you get the same totals.
Example 1: a 10-host startup — about $379 per month
| Line | Calculation | Monthly |
|---|---|---|
| Infrastructure Pro | 10 hosts × $15 | $150 |
| Containers | 40 containers, 50 included | $0 |
| Custom metrics | 800 series, 1,000 included | $0 |
| APM | 5 APM hosts × $31 (spans within allotment) | $155 |
| Log ingestion | 100 GB × $0.10 | $10 |
| Log indexing, 15-day | 30M events × $1.70 | $51 |
| Synthetics | 1 API test every 5 min from 3 locations ≈ 26K runs | $13 |
| Total | $379 |
Nothing here surprises. APM is the largest line, and the allotments absorb containers and custom metrics completely.
Example 2: a 50-host product team — about $3,006 per month
| Line | Calculation | Monthly |
|---|---|---|
| Infrastructure Pro | 50 hosts × $15 | $750 |
| Containers | 400 containers − 250 included = 150 × $1 | $150 |
| Custom metrics | 12,000 series − 5,000 included = 7,000 × $0.05 | $350 |
| APM | 30 hosts × $31 | $930 |
| Indexed spans | 60M − 30M included = 30M × $1.70 (15-day) | $51 |
| Log ingestion | 1,000 GB × $0.10 | $100 |
| Log indexing, 15-day | 300M events × $1.70 | $510 |
| RUM + Session Replay | 200K sessions × $0.15/1K + 10K replays × $2.50/1K | $55 |
| Synthetics | 100K API runs + 5K browser runs | $110 |
| Total | $3,006 |
Two observations. Log indexing costs five times log ingestion. And on month-to-month pricing the same bill is about $3,454: $448 more, roughly 13%. That is less than the 16–20% gap on host and indexing prices, because ingestion, containers and custom metrics cost the same on every billing option.
Example 3: the cardinality incident — +$6,750 overnight
Take the same team and add one tag to one metric: checkout.latency tagged with user_id. If 45,000 users check out across 3 endpoints in a month, that metric alone reports up to 135,000 distinct series.
| Line | Calculation | Monthly |
|---|---|---|
| New series | 45,000 users × 3 endpoints | 135,000 |
| Allotment left | already used by the other metrics | 0 |
| Added cost | 135,000 × $0.05 | +$6,750 |
One line of instrumentation more than tripled a $3,006 bill. Nothing changed in hosts or traffic. This pattern is the most common cause of "our Datadog bill jumped" threads, and our guide to Datadog high cardinality shows how to find the offending tag. The calculator's custom-metrics section flags it automatically.
What drives Datadog costs up: the five usual suspects
In rough order of how often they cause a surprise:
- A high-cardinality tag on a custom metric.
user_id,request_id,session_id, full URL paths or container IDs as tags. - Indexing every log. Debug lines, health checks and 200-OK access logs indexed at 15 or 30 days.
- APM on autoscaled fleets. Each instrumented host is an APM host. If a nightly batch fleet runs long enough to land in the 99th percentile, it is billed for the whole month.
- Distribution metrics everywhere. Each one counts several times; use them for latency, not for counters.
- On-demand pricing by default. Teams that never signed a commitment pay 16–20% more on every host and indexing line.
How to reduce your Datadog bill
Each fix maps to one of the suspects above, ranked by typical saving:
- Drop or limit unbounded tags. Remove
user_id-style tags, or use Metrics without Limits to index only the tags you actually query. This often removes the largest single line. - Add log exclusion filters and shorten retention. Exclude health checks and debug logs from indexes, and move chatty services from 15-day to 3-day indexing ($1.70 to $1.06 per million). Keep everything in an archive for compliance.
- Instrument APM where it earns its keep. Trace user-facing services; leave batch workers on infrastructure metrics. See APM and distributed tracing for retention filters that control span costs.
- Tune synthetics frequency. An API test every minute from five locations runs about 216,000 times a month. Every five minutes from three locations is enough for most health checks. Our synthetic monitoring guide covers sensible intervals.
- Commit annually once usage is stable. Do this last: commit to a baseline after the fixes above, not before.
If you are comparing vendors because the bill is already too high, our Datadog alternatives comparison covers Grafana, New Relic, Elastic and open-source stacks honestly, including where they cost more.
Common mistakes when estimating Datadog cost
- Multiplying the host price by host count and stopping there. For most production teams, infrastructure is less than a third of the bill.
- Assuming log cost is the ingestion price. $0.10/GB looks cheap. Indexing is usually 3–6× larger.
- Forgetting that allotments are pooled. Teams overestimate container and custom-metric costs by applying allotments per host instead of across the account.
- Pricing on annual rates without a commitment. The annual column only applies if you sign one.
- Ignoring products that are not modelled here. Database monitoring, Cloud SIEM, CI Visibility and Profiler each have their own meters.
Estimate your own Datadog bill
The fastest way to apply all of this is the free Datadog pricing calculator. Toggle the products you use, enter your volumes, and it applies every allotment and retention tier above, shows the total and a per-product breakdown, and flags the custom-metric tag driving your cost. You can share the estimate as a link with your team.
New to the platform itself? Start with what Datadog is and how it works, then come back here once you know which products you need.
Frequently Asked Questions
How much does Datadog cost per month?
It depends on which products you turn on. At annual list prices, a 10-host startup using infrastructure, APM on 5 hosts, 100 GB of logs and one synthetic test pays about $380 a month. A 50-host team running infrastructure, APM, logs, RUM and synthetics pays about $3,000 a month. Custom metrics and indexed logs are what push bills higher than that.
Is Datadog billed per host?
Partly. Infrastructure monitoring ($15 Pro, $23 Enterprise per host per month on annual billing) and APM ($31 to $40 per APM host) are billed per host. Datadog meters hosts every hour and bills on the 99th percentile of the month, so short autoscaling spikes are mostly ignored. Logs, spans, RUM and synthetics are billed by volume, and custom metrics by distinct series.
Why is my Datadog bill so high?
Usually one of two meters that grow with your code rather than your fleet. Custom metrics are billed per unique metric and tag-value combination, so a tag like user_id can add hundreds of thousands of billable series overnight. Indexed logs are billed per million events, so indexing debug and health-check logs multiplies the bill. Check those two lines before anything else.
What is the difference between Datadog annual and on-demand pricing?
Annual billing requires a committed volume and gives the lowest rates. Month-to-month and on-demand cost more: infrastructure Pro is $15 annual versus $18 on-demand, and 15-day log indexing is $1.70 versus $2.55 per million events. Flat per-unit prices such as log ingestion, containers and custom metrics are the same on every option, so a whole bill typically saves 10 to 15 percent on annual.
Does Datadog have a free plan?
Yes. The free infrastructure tier covers up to 5 hosts with 1-day metric retention and core dashboards. It is enough to learn the product or monitor a hobby project, but not for production: metrics history lasts only a day, and APM, logs and the other products are billed separately from the first unit.
How can I estimate my Datadog bill before signing up?
List your host count, average containers per host, APM hosts, monthly log GB and indexed events, RUM sessions and synthetic test runs, then multiply each by its list price after subtracting the per-host allotments. The free SolutionGigs Datadog pricing calculator does this for every product at once and shows which tag is driving your custom-metrics cost.
Conclusion
Datadog pricing becomes predictable once you sort its meters into three groups. Per-host products (infrastructure, APM) set a floor you can budget for. Per-volume products (logs, spans, RUM, synthetics) grow with traffic. Per-series custom metrics grow with your code, and that is where nearly every surprise invoice starts. Price the first two from the table above, watch the third with a cardinality check before every new tag, and keep log indexing narrow.
To put numbers on your own setup, run it through the Datadog pricing calculator. If your bill is already out of hand and you want someone to find the cause, SolutionGigs can help →.
Mohammed Yaseen
Founder, SolutionGigs
Mohammed builds observability for Kafka, Spark and EMR data platforms and builds Telemetrix, an infrastructure-monitoring product, so he spends a lot of time reading monitoring bills line by line. LinkedIn →
Try the Free Datadog Pricing Calculator
Free, no signup — right in your browser.
Try the Free Datadog Pricing Calculator →More in DevOps & Monitoring
Datadog High Cardinality: Why Your Custom-Metrics Bill Exploded
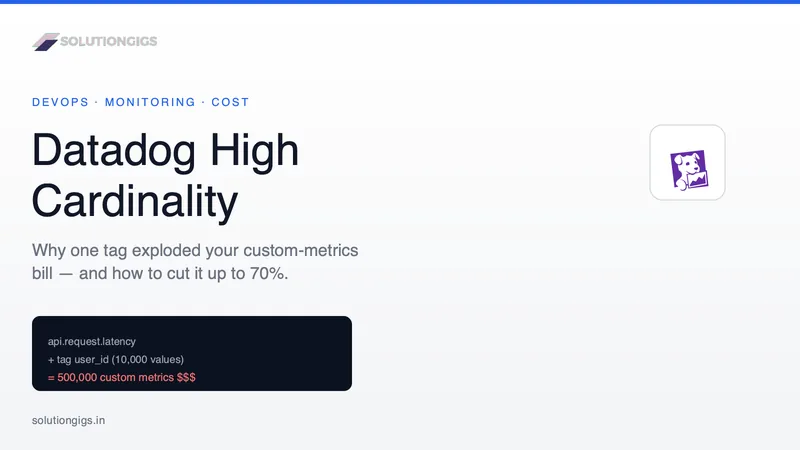
Open a Datadog invoice and find custom metrics dwarfing everything else? The culprit is cardinality — and almost always one or two tags. This is the mechanic made concrete: a custom metric is billed per unique combination of metric name and tag values, so one metric tagged by user_id (10,000 values) × endpoint × status isn't one metric, it's 500,000 billable ones. Includes how to find the offenders (Metrics Summary, Cardinality Explorer, Estimated Usage) and the fix that cuts cost up to 70% without losing a dashboard — Metrics without Limits plus disciplined tagging.
Datadog Agent Not Reporting? The Ordered Fix Guide
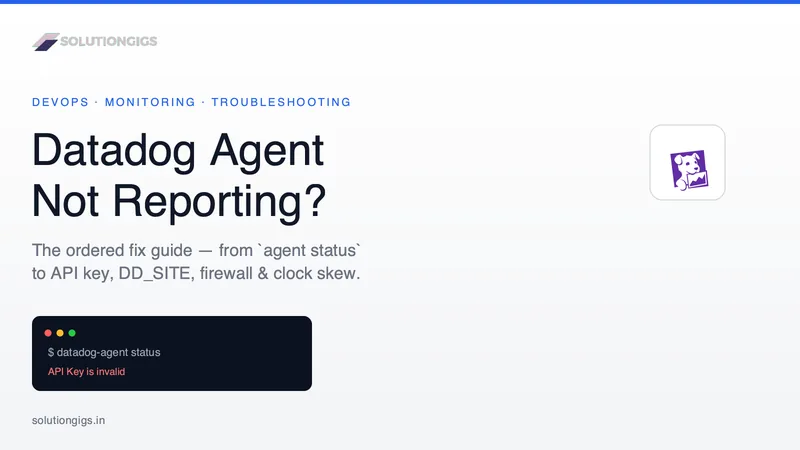
Most "my Datadog agent isn't sending metrics" guides hand you an unordered pile of things to check. This one gives you the diagnostic order: run datadog-agent status and read the Forwarder, then work six causes top to bottom — agent up/crashloop, API key valid, correct DD_SITE, outbound 443 connectivity, NTP clock skew, cardinality — with the exact failure signature and fix for each. The two that catch nearly everyone (invalid key, wrong site) look perfectly healthy from systemctl, which is why you read the Forwarder instead.
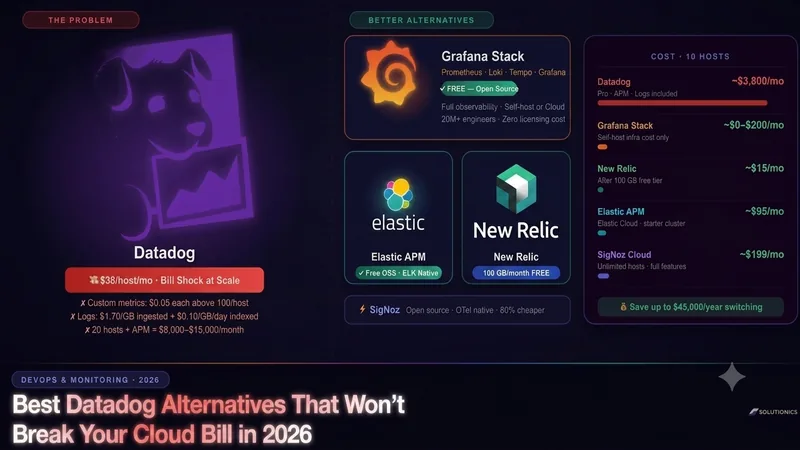
Best Datadog Alternatives: Cut Your Monitoring Bill by 70%
Datadog too expensive? Compare Grafana Stack, New Relic, Elastic APM, and SigNoz with real pricing, honest trade-offs, and a 4-week migration playbook.