

Datadog High Cardinality: Why Your Custom-Metrics Bill Exploded
Last Updated: July 2026 | 13 min read
🔭 The cost half of our observability cluster. It ties together the offenders in Datadog Spark monitoring, Kafka lag monitoring, and Databricks monitoring. New to the platform? Start with the free Datadog & Bits AI course.
Quick Answer: High cardinality in Datadog is when a metric's tags have many unique values, and because Datadog bills one custom metric for every unique combination of metric name and tag values, that multiplies into a huge, expensive count. A metric tagged by user_id (10,000 values) × endpoint (10) × status (5) isn't one metric — it's 500,000 billable custom metrics. The fix is to cut cardinality, not visibility: use Metrics without Limits to keep an allowlist of only the tags you actually query, and never tag by unbounded values like user_id, request_id, pod, container_id, or run_id. Teams doing this routinely cut custom-metrics cost up to 70% without losing a single dashboard.
If you've ever opened a Datadog invoice and found custom metrics dwarfing everything else, the culprit is almost always cardinality — and almost always one or two tags. This is the guide that explains the mechanic so it clicks, shows you how to find the offenders in your own account, and gives you the exact fixes. It's the cost companion to the rest of our monitoring cluster: Spark, Kafka, and Databricks pipelines are the most common cardinality offenders precisely because they emit per-partition, per-executor, and per-run identifiers.
What is high cardinality in Datadog?
High cardinality means a metric carries tags whose values are many and unbounded, producing a large number of distinct time series — and in Datadog, each distinct time series is a billable custom metric. "Cardinality" is just the count of unique values a tag can take.
A tag like env has low cardinality (prod, staging, dev — three values). A tag like user_id has effectively unbounded cardinality: one value per user, forever. Low-cardinality tags are cheap and useful; unbounded tags are what detonate your bill.
The key definition to internalize: a custom metric is a unique combination of a metric name and its tag values (host included). Change one tag value, and you've created another billable series.
| Tag | Example values | Cardinality | Safe to index? |
|---|---|---|---|
env |
prod, staging, dev | Low (3) | ✅ Yes |
service |
a few dozen | Low–medium | ✅ Yes |
endpoint |
tens | Medium | ✅ Usually |
user_id |
one per user | Unbounded | ❌ No |
request_id / trace_id |
one per request | Unbounded | ❌ No |
pod / container_id / run_id |
one per pod/run | Unbounded | ❌ No |
The rule of thumb: if a tag's set of values grows without bound as traffic, users, pods, or pipeline runs increase, it does not belong on a metric.
How Datadog counts (and bills) custom metrics
Datadog counts one custom metric per unique metric-name-plus-tag-value combination, totals the distinct series each hour, and averages that over the month to bill you. This multiplicative counting is why cardinality — not the number of metric names — drives cost.
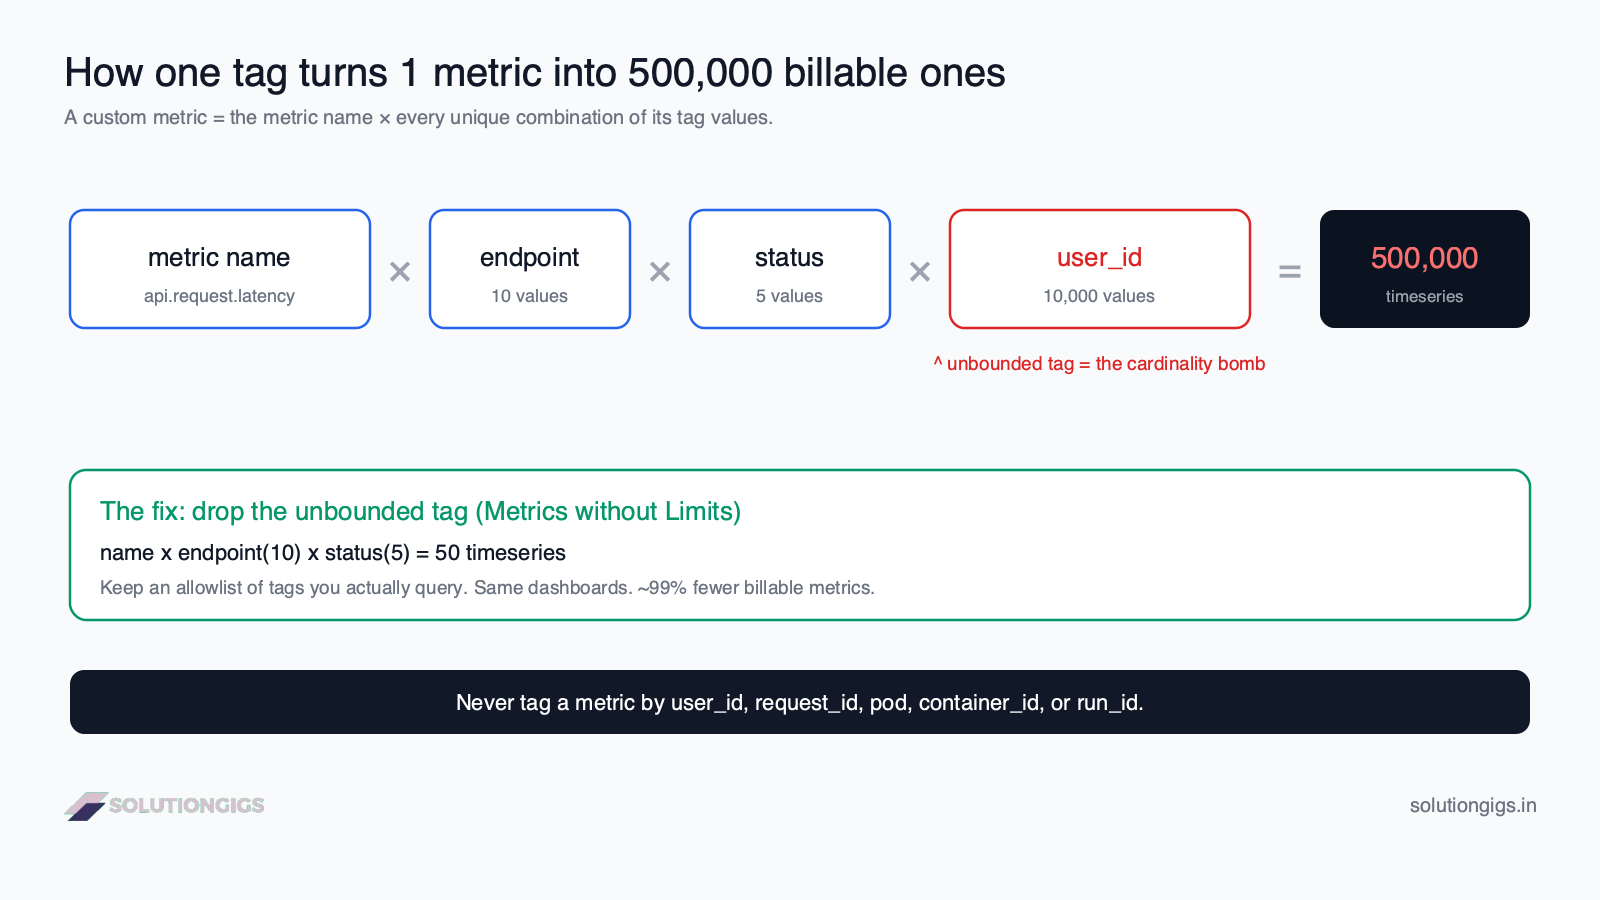
Walk the multiplication in the diagram above:
api.request.latency— one metric name.× endpoint(10 values)× status(5 values)× user_id(10,000 values)=500,000 unique time series = 500,000 custom metrics you pay to index.
A few billing facts worth knowing so the numbers aren't a surprise (official custom-metrics billing docs):
- Your billable usage is the hourly count of distinct custom metrics, averaged across the month — a short spike matters less than sustained cardinality.
- Plans include an allowance (e.g. 100 custom metrics per host on Pro), then bill extra indexed metrics at roughly $5 per 100/month.
- Metric type matters: GAUGE, COUNT, and RATE = 1 custom metric per tag combination; DISTRIBUTION = 5 (count, min, max, sum, avg). Distributions on a high-cardinality metric are 5× the damage.
The mechanic in one line: you don't pay per metric name — you pay per unique tag combination. Cardinality is the multiplier, and one unbounded tag is enough to dominate the whole bill.
Why pipelines are the worst offenders
Data pipelines emit ephemeral identifiers by nature, so Spark, Kafka, and Databricks metrics are cardinality minefields. This is exactly where our monitoring guides keep warning you.
- Spark produces
application_id,executor_id,stage_id,job_id— every run mints new values. See the cardinality note in Datadog Spark monitoring. - Kafka per-partition lag on a high-partition topic multiplies fast — covered in Kafka lag monitoring.
- Databricks tempts you to tag by
cluster_id/run_id, both ephemeral — see Databricks monitoring.
Tag any metric by those and each pipeline run creates brand-new series you pay for and never look at again.
How to find your high-cardinality metrics
Before you change anything, find the offenders — Datadog gives you three views that pinpoint them. Diagnose, then fix; don't guess.
- Metrics Summary — sort by the number of distinct time series (volume). The metrics at the top with a large tag count are your suspects.
- Tag configuration / Cardinality Explorer — open a suspect metric's Metrics without Limits config (or the Tag Cardinality Explorer) to see which specific tag is driving the count. It's usually one.
- Usage & Estimated Usage — these pages show ingested vs indexed custom-metric volume and the trend over time, so you can confirm the bill impact and measure your fix afterward.
The official governance guidance recommends this find-then-fix loop rather than blanket metric deletion.
How to reduce Datadog custom-metrics cost
Cut cardinality, not visibility — the main lever is Metrics without Limits, backed by disciplined tagging. Here's the priority order.
1. Use Metrics without Limits (the biggest win)
Metrics without Limits decouples ingestion from indexing: you keep sending all your data, but define an allowlist of tags that stay queryable. Only the indexed set is billed. Drop user_id from the allowlist and your 500,000-series metric collapses to 50 — same dashboards, ~99% fewer billable series. Datadog reports teams applying this to unqueried metrics often see up to 70% lower custom-metrics usage.
2. Remove unbounded tags at the source
If your own code or check emits the tag, stop emitting it. Never tag a metric by user_id, request_id, session_id, container_id, pod, trace_id, or run_id. Those belong in logs and traces, not metric tags.
3. Aggregate to what you alert and dashboard on
Keep the dimensions you actually group by — service, env, endpoint, consumer_group, cluster_name — and drop the rest. If no monitor or dashboard queries a tag, you're paying to index noise.
4. Prune dead metrics
Metrics nobody has queried in 30–90 days are pure cost. The Metrics Summary flags unqueried metrics; stop emitting them.
See how SolutionGigs can help → If your Datadog bill is mostly custom metrics and you're not sure which pipeline is responsible, a short audit usually pays for itself.
Common mistakes with Datadog cardinality
- Tagging metrics by unbounded IDs (
user_id,run_id,container_id) — the #1 cause, every time. - Deleting metrics instead of trimming tags — you lose visibility and often keep the expensive tag on what remains. Trim tags with Metrics without Limits instead.
- Putting high-cardinality dimensions on DISTRIBUTION metrics — that's 5× the series. Reserve distributions for low-cardinality tag sets.
- Ignoring the ingested-vs-indexed split — after configuring Metrics without Limits, watch Estimated Usage to confirm the drop; don't assume.
- Fixing it once — cardinality creeps back as teams add tags. Review the Metrics Summary on a cadence (this is exactly the kind of thing worth a monthly check).
Frequently Asked Questions
What is high cardinality in Datadog?
High cardinality means a metric has tags with many unique values, which multiplies into many distinct time series. Datadog counts one custom metric per unique combination of metric name and tag values, so a metric tagged by a high-cardinality dimension like user_id or pod generates one billable custom metric per unique value. A metric tagged by 10,000 user IDs becomes at least 10,000 custom metrics — that's high cardinality, and it's the main driver of surprise bills.
How are Datadog custom metrics counted and billed?
A custom metric is a unique combination of a metric name and its tag values, including the host. Datadog counts the distinct custom metrics each hour and averages over the month for your billable usage. Plans include an allowance (e.g. 100 per host on Pro) and bill extra indexed metrics around $5 per 100/month. GAUGE, COUNT, and RATE create 1 custom metric per tag combination; DISTRIBUTION creates 5.
How do I find high-cardinality metrics in Datadog?
Use the Metrics Summary page to sort by distinct time series and spot metrics with the most tags, then open a suspect's Metrics without Limits tag configuration or the Tag Cardinality Explorer to see which tag drives the count. The Usage and Estimated Usage pages show ingested vs indexed volume and the trend, so you can confirm impact before and after your fix.
How do I reduce Datadog custom-metrics cost?
Cut cardinality, not metrics. Use Metrics without Limits to keep an allowlist of only the tags you query, so you stop indexing high-cardinality tags while still ingesting the data. Remove unbounded tags like user_id, request_id, and run_id; aggregate to the dimensions you alert and dashboard on; and stop emitting metrics nobody queries. Teams often cut usage up to 70% this way without losing visibility.
How many custom metrics is too many?
There's no single number, but any single metric producing tens of thousands of time series from one high-cardinality tag is almost always waste. Compare your indexed count against your plan's allowance (e.g. 100 per host) and watch the Usage trend. A metric whose cardinality grows without bound as users, pods, or runs increase is the real problem, regardless of today's absolute number.
What is Metrics without Limits in Datadog?
It's a feature that decouples ingestion cost from indexing cost. You still send all your data (ingested cheaply), but configure an allowlist of tags that stay queryable (indexed). Only indexed tags count toward billable custom metrics, so dropping user_id from indexing slashes cost while keeping the raw data available if you later re-add a tag. It's the primary lever for high-cardinality spend.
Does high cardinality affect anything besides cost?
Yes. Very high-cardinality queries are slower to render and can hit query limits, and dashboards tagged by unbounded values become unreadable. Trimming cardinality usually makes your graphs faster and clearer as a side benefit, not just cheaper.
Conclusion
Datadog high cardinality is a multiplication problem: you pay per unique tag combination, so one unbounded tag can turn a single metric into hundreds of thousands of billable series. The path out is always the same — find the offender in the Metrics Summary, confirm it in the Cardinality Explorer, then cut the tag with Metrics without Limits rather than deleting the metric. Keep the dimensions you alert on, drop the IDs that belong in logs, and you'll typically shave a large chunk off the bill with zero loss of visibility.
This completes our observability cluster alongside Spark, Kafka lag, Databricks, and agent troubleshooting — and if the bill is the real issue, weigh the best Datadog alternatives. Staring at a custom-metrics bill you can't explain? Get matched with a vetted DevOps or data engineer on SolutionGigs — it's free to post a project.

Mohammed Yaseen
Founder, SolutionGigs
Mohammed has traced more than one runaway Datadog bill back to a single ephemeral tag on a Spark or Kafka pipeline, and cut it with Metrics without Limits. He teaches the free Learn Data Engineering course. LinkedIn →