Best Datadog Alternatives in 2026: Cut Your Monitoring Bill by 70%
Last Updated: June 2026 · 15 min read
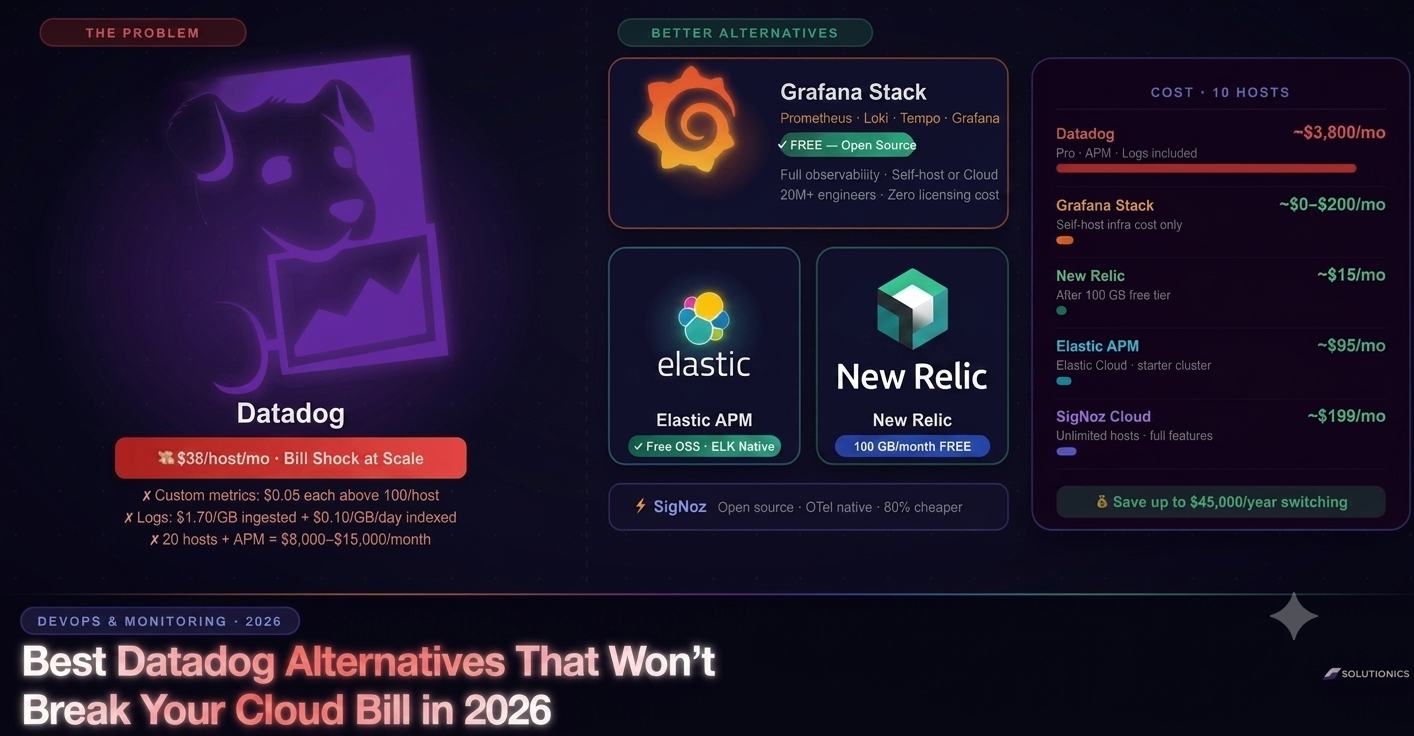
Quick Answer: The best Datadog alternatives in 2026 are: Grafana Stack (free, open source, full observability), New Relic (100 GB/month free tier, per-GB pricing after), Elastic APM (open source, strong if you're already in the ELK ecosystem), and SigNoz (open-source, OTel-native, 80% cheaper than Datadog on Cloud). For most startups and scale-ups, Grafana Stack self-hosted or New Relic will reduce your monitoring bill by 60–90% with no meaningful loss of capability.
There's a recurring pattern in engineering teams that reach a certain scale: the AWS bill surprises you in Q1, the Datadog bill surprises you in Q2.
Datadog is genuinely excellent software. The dashboards are polished. The alerting works. The integrations cover every tool in your stack. But the pricing model is designed to grow faster than your infrastructure. Every new host, every custom metric, every GB of logs ingested adds to a bill that compounds in ways that are very hard to predict.
A team running 20 hosts with APM, Infrastructure Monitoring, Log Management, and a handful of custom dashboards can pay $8,000–$15,000 per month. That's $100,000–$180,000 per year for observability alone.
In this guide we cover the four best Datadog alternatives in 2026 — with honest pricing, real trade-offs, and a migration path for each. We've used all of these in production across data engineering and SaaS infrastructure contexts, so the recommendations here are grounded in real-world use.
Why Datadog Gets So Expensive
Datadog's pricing is per-host, per-metric, and per-GB — and all three scale independently.
Understanding why the bill is high requires understanding the three billing dimensions:
1. Per-Host Infrastructure Pricing
Datadog charges $15/host/month on the Pro plan and $23/host/month on the Enterprise plan for infrastructure monitoring alone. This is the entry point — before you add a single feature.
APM (application performance monitoring) adds another $31/host/month on Pro. Log Management adds $1.70/GB ingested plus $0.10/GB indexed per day. So a single production host with APM and logs can cost $55–$70/month on the Datadog bill, even without counting custom metrics.
2. Custom Metrics Explosion
Datadog gives you 100 custom metrics per host included. Every metric beyond that is $0.05/custom metric/month. This sounds trivial until you instrument your application properly. A moderately instrumented microservice generating 500 metrics runs up $20/month in custom metric overages per host — on top of the base rate.
Teams instrumenting Kafka consumer lag, database query times, cache hit rates, and business metrics (revenue events, funnel conversions) routinely end up with 1,000–5,000 custom metrics per service. At scale, this alone can double your Datadog bill.
3. Log Volume Surprises
Log costs are the most unpredictable part. Production systems under load generate far more log data than anyone anticipates in the planning stage. A 10-service application under moderate traffic can generate 50–200 GB of logs per day. At $1.70/GB ingested, that's $85–$340/day — $2,550–$10,200/month — in log costs alone.
The 15-day retention limit on the base plan means you're also paying for log archives to S3 if you need longer history.
The 4 Best Datadog Alternatives in 2026
1. Grafana Stack (Grafana + Prometheus + Loki + Tempo)
Best for: Teams with engineering bandwidth to self-host · any scale · zero budget for tooling
Cost: $0 self-hosted · Grafana Cloud free tier (10K series, 50 GB logs, 50 GB traces/month) · Grafana Cloud Pro from $8/month
The Grafana Stack is the most powerful Datadog alternative available — and in its self-hosted form, it's completely free. It covers every observability dimension:
- Prometheus — metrics collection and storage. The de facto standard for Kubernetes and cloud-native metrics. Pulls metrics from every service, infrastructure component, and third-party exporter you can imagine.
- Loki — log aggregation. Designed to be cost-efficient: indexes only metadata (labels), stores log content in object storage (S3/GCS). Far cheaper to operate than Elasticsearch-based solutions at log scale.
- Tempo — distributed tracing. Stores traces in object storage, integrates natively with Grafana dashboards. Full compatibility with OpenTelemetry, Jaeger, and Zipkin trace formats.
- Grafana — the unified dashboarding and alerting layer. The same Grafana dashboards you use on Grafana Cloud work identically self-hosted.
The real cost of Grafana self-hosted is infrastructure — typically 2–4 VMs for a production setup with HA, plus S3/GCS storage. For most startups this is $100–$400/month in infrastructure, compared to $5,000–$15,000/month in Datadog fees.
What Grafana doesn't do as well as Datadog: - No out-of-the-box APM with automatic code instrumentation. You need to add OpenTelemetry SDK to your services. - Dashboard creation has a steeper learning curve than Datadog's drag-and-drop interface. - No built-in synthetic monitoring (Grafana Synthetic exists but requires configuration). - Alert management is improving rapidly but Datadog's incident management features are more mature.
The migration path: Replace Datadog agents with Prometheus exporters and OpenTelemetry collectors. Ship logs to Loki via Promtail or the OTel log exporter. Add Tempo to your OTel pipeline for traces. Give your engineering team 2–3 weeks to rebuild dashboards — many Datadog dashboards have community-built Grafana equivalents in the Grafana dashboard library.
For teams building data engineering infrastructure on Kafka, Spark, or EMR — tools we cover in our Databricks vs AWS EMR guide — Grafana's native Kafka and JVM exporters make the migration particularly smooth.
2. New Relic
Best for: Teams wanting a managed SaaS alternative · startups on a budget · predictable pricing
Cost: Free forever (100 GB data ingest/month, 1 full user, unlimited basic users) · $0.30/GB after free tier · $99/month/full user for advanced features
New Relic completely overhauled its pricing model in 2023 and the result is one of the most startup-friendly observability platforms available. The free tier is genuinely useful — not artificially limited.
100 GB of data ingest per month covers most teams with up to 10–20 services in production. Full-stack observability: APM, infrastructure monitoring, log management, browser monitoring, and synthetic checks are all included in a single data ingestion pipeline. No per-host charges. No per-metric charges. One number: GB ingested.
The actual New Relic bill for 10 hosts:
If your 10 hosts generate ~150 GB of telemetry per month (metrics + logs + traces combined), your New Relic bill is: 100 GB free + 50 GB × $0.30 = $15/month. Compare that to $3,800–$8,000/month on Datadog.
What New Relic doesn't match on Datadog: - The dashboard UX is less polished. Datadog's drag-and-drop dashboard experience is genuinely excellent. - Custom alerting conditions have a steeper learning curve in New Relic's NRQL query language. - Datadog's integrations directory (600+ integrations) slightly exceeds New Relic's.
Migration path: Install the New Relic infrastructure agent on each host, replace Datadog APM agents with New Relic's language agents, configure log forwarding. New Relic publishes migration guides from Datadog for every major language and framework.
3. Elastic APM (ELK Stack)
Best for: Teams already running Elasticsearch · strong search requirements · on-premise or cloud-agnostic deployments
Cost: Self-hosted open-source is free · Elastic Cloud from $95/month (8 GB RAM, 240 GB storage) for a starter monitoring cluster
Elastic APM is part of the broader Elastic Observability solution — built on the same Elasticsearch and Kibana stack that powers many teams' search and analytics infrastructure. If you're already running ELK for log aggregation, adding Elastic APM is a natural extension rather than a migration.
Elastic Observability covers: - Elastic APM — distributed tracing, transaction monitoring, error tracking across 14 languages - Metricbeat — infrastructure metrics from servers, Kubernetes, cloud platforms, databases - Filebeat — log collection from any source - Kibana — dashboards, ML-based anomaly detection, alerting, and Discover for log exploration
Elastic's ML features (anomaly detection, forecasting) are genuinely strong — arguably better than Datadog's equivalent features for specific use cases like log anomaly detection and metric forecasting.
What Elastic doesn't do as well: - Operational complexity is higher than Datadog or New Relic. Running Elasticsearch at scale requires expertise in cluster sizing, shard management, and index lifecycle policies. - The APM UI is less polished than Datadog's. - Querying in Kibana (KQL / Elasticsearch DSL) has a steeper learning curve than Datadog's search.
Migration path: If you're already running ELK, install Elastic APM agents in your services, configure Metricbeat to replace Datadog infrastructure agents. Kibana dashboards need to be rebuilt, but Elastic has a library of pre-built Kibana dashboards for common infrastructure components.
4. SigNoz
Best for: Teams wanting a modern open-source Datadog replacement · OpenTelemetry-first architectures · avoiding any vendor lock-in
Cost: Self-hosted free (ClickHouse-based, low infrastructure cost) · SigNoz Cloud from $199/month for unlimited hosts with full features
SigNoz is the most rapidly growing Datadog alternative in 2026 — and for good reason. It was built from the ground up for the OpenTelemetry era, using ClickHouse as the storage backend for high-performance metric and trace querying.
Why SigNoz stands out: - True OTel native — uses standard OpenTelemetry SDKs with no proprietary agents. Switching from SigNoz to any other OTel-compatible tool in the future requires zero code changes. - ClickHouse backend — dramatically more cost-efficient for trace and log storage than Elasticsearch or proprietary databases. A month's worth of traces that costs $500 in Datadog APM might cost $15 in ClickHouse storage. - No per-host pricing — SigNoz Cloud charges by data volume, not infrastructure topology. - Unified UI — metrics, traces, and logs in a single interface with correlation built in, similar to Datadog's experience.
What SigNoz is still building: - Synthetic monitoring — not yet available (roadmapped) - RUM (Real User Monitoring) — limited support - The dashboard ecosystem is smaller than Datadog's or Grafana's
Migration path: Replace Datadog agents with OpenTelemetry collectors. Point your OTel exporters at SigNoz. Because SigNoz is OTel-native, the agent migration is often the simplest of any alternative — just update the endpoint configuration.
Head-to-Head: Datadog vs Alternatives
| Feature | Datadog | Grafana Stack | New Relic | Elastic APM | SigNoz |
|---|---|---|---|---|---|
| Pricing model | Per host + per metric + per GB | Free / infra cost | Per GB ingested | Free OSS / GB on Cloud | Free OSS / flat Cloud |
| 10-host monthly cost | $3,800–$8,000 | $100–$400 (infra) | ~$15 | $95–$200 | $0 (self-host) |
| Setup complexity | Low (managed) | High (self-host) | Low (managed) | Medium | Medium |
| APM quality | ★★★★★ | ★★★★☆ | ★★★★☆ | ★★★★☆ | ★★★★☆ |
| Log management | ★★★★★ | ★★★★☆ | ★★★★☆ | ★★★★★ | ★★★★☆ |
| Dashboard UX | ★★★★★ | ★★★★☆ | ★★★☆☆ | ★★★☆☆ | ★★★★☆ |
| Vendor lock-in | High | None | Medium | Medium | None (OTel) |
| ML / anomaly detection | ★★★★☆ | ★★★☆☆ | ★★★☆☆ | ★★★★☆ | ★★☆☆☆ |
| Open source | ✗ | ✓ | ✗ | ✓ (core) | ✓ |
How to Decide: A 3-Question Framework
Question 1: Does your team have a DevOps engineer who can manage infrastructure?
- Yes → Grafana Stack self-hosted. The cost savings are enormous and the capability is full enterprise-grade.
- No → New Relic (SaaS, zero ops, generous free tier) or SigNoz Cloud (OTel-native, flat pricing).
Question 2: Are you already running Elasticsearch?
- Yes → Elastic APM is the lowest-friction path. You're extending existing infrastructure, not replacing it.
- No → Skip Elastic unless log search depth is a specific requirement.
Question 3: Are you starting fresh or migrating?
- Starting fresh → SigNoz (OTel-native from day one means no future lock-in) or New Relic (fastest time to value).
- Migrating from Datadog → Grafana Stack has the deepest feature parity. Expect 3–6 weeks for a thorough migration.
The Migration Playbook: Leaving Datadog Without Breaking Production
Migrating observability is risky if done wrong — you can end up blind to production issues mid-migration. Here's a safe approach:
Phase 1: Run in Parallel (Week 1–2)
Deploy your alternative alongside Datadog. Install Prometheus exporters or OTel collectors on your hosts without removing Datadog agents. Both systems collect data simultaneously. This lets you validate data quality and build dashboards in the new tool before cutting over.
Phase 2: Migrate Dashboards (Week 2–3)
Rebuild your top 10 most-used dashboards in the new tool. These are usually: infrastructure overview, service latency distribution, error rate by service, database connection pool health, and the on-call runbook dashboards. Import community-built equivalents where they exist — Grafana's dashboard library has 4,000+ pre-built dashboards covering almost every common infrastructure component.
Phase 3: Migrate Alerts (Week 3–4)
Recreate every alert that pages your on-call team. Test each alert by simulating the condition in a staging environment. Only after every critical alert fires correctly in the new tool should you proceed to cut-over.
Phase 4: Remove Datadog Agents (Week 4)
Remove Datadog agents from one host at a time, verifying the new tool captures equivalent data for each host before moving to the next. Cancel Datadog after the full cut-over and one clean billing cycle of validation.
What About Dynatrace?
Dynatrace is Datadog's closest enterprise competitor — and equally expensive. It's the right choice for large enterprises with complex .NET and Java environments where Dynatrace's AI-powered root cause analysis (Davis AI) provides genuine value. For startups and scale-ups, Dynatrace's pricing ($69/host/month for full-stack monitoring) makes it even more expensive than Datadog for most use cases. It's not a cost-saving alternative — it's a capability trade-off at similar price points.
Building Your Own Observability Stack on AWS or Datadog-Free
If your infrastructure runs on AWS, there's an additional path worth considering: AWS native observability.
- CloudWatch for infrastructure metrics and logs (already included in AWS cost)
- AWS X-Ray for distributed tracing ($5/million traces)
- OpenSearch (managed Elasticsearch) for log analysis
- Amazon Managed Grafana for dashboarding
This approach is particularly compelling if you're already paying AWS committed-use discounts — some of the cost is effectively pre-paid. The trade-off is that AWS-native tools are more fragmented than Datadog's unified experience, and the Grafana/Prometheus ecosystem integrates more naturally with multi-cloud architectures.
For teams running Kafka and Spark workloads — topics we covered in our Kafka consumer lag guide and Spark streaming tuning guide — Prometheus with JMX exporters gives you the same metric depth as Datadog at zero licensing cost.
Frequently Asked Questions
Why is Datadog so expensive?
Datadog charges per host, per custom metric, and per GB of logs — three billing dimensions that scale independently. A 20-host production environment with APM and log management easily reaches $8,000–$15,000/month. The per-metric overage charges and log ingestion costs are where most teams are surprised.
What is the best free alternative to Datadog?
The Grafana Stack (Grafana + Prometheus + Loki + Tempo) is the best free alternative. It covers metrics, logs, and traces at zero licensing cost — you pay only for the infrastructure to run it, typically $100–$400/month for a production setup that would cost $5,000+/month on Datadog.
Is New Relic cheaper than Datadog?
Yes, significantly. New Relic's 100 GB/month free tier is genuinely usable for most small teams. After the free tier, you pay $0.30/GB ingested — no per-host or per-metric charges. For 10 hosts generating 150 GB/month of telemetry, New Relic costs approximately $15/month vs $3,800–$8,000 on Datadog.
What is SigNoz and how does it compare to Datadog?
SigNoz is an open-source, OpenTelemetry-native observability platform built on ClickHouse. Self-hosted SigNoz is completely free. SigNoz Cloud starts at $199/month for unlimited hosts — 80–90% cheaper than Datadog. Its key advantage is zero vendor lock-in: standard OTel SDKs mean your instrumentation code never changes if you switch tools.
How hard is it to migrate from Datadog to Grafana?
A typical migration takes 3–6 weeks for a team of 5–10 engineers. The main effort is rebuilding dashboards and alert rules. Many Datadog dashboards have community-built Grafana equivalents. The safest approach is running both tools in parallel for 2 weeks before cutting over.
Does Elastic APM replace Datadog?
Yes, for most use cases. Elastic APM covers distributed tracing, infrastructure metrics, and log management. It's particularly strong for teams already running Elasticsearch. Self-hosted Elastic APM is open-source and free. Elastic Cloud is typically 60–75% less expensive than Datadog for equivalent workloads.
Which Datadog alternative is best for startups?
New Relic is the best for startups — 100 GB/month free forever, no credit card required, no per-host pricing. Grafana Cloud's free tier is a close second for teams with DevOps experience. SigNoz self-hosted is ideal if you have an engineer who can manage a ClickHouse deployment.
Conclusion
Datadog's bill shock is one of the most common engineering budget discussions in 2026. The good news: the alternatives have genuinely matured. Grafana Stack, New Relic, Elastic APM, and SigNoz all provide enterprise-grade observability at a fraction of Datadog's cost.
The right choice depends on your team's operational capacity, your existing infrastructure, and whether you prioritise zero licensing cost (Grafana/SigNoz self-hosted) or zero operational overhead (New Relic, SigNoz Cloud).
What you shouldn't do is stay on Datadog because migration feels daunting. A well-planned 4-week migration to Grafana or New Relic typically saves $50,000–$150,000 per year — more than enough to justify the engineering time spent on the switch.
If you need help designing and implementing your observability stack migration — from Datadog to Grafana, New Relic, or a custom AWS-native solution — our infrastructure and DevOps engineers at solutiongigs.in have done this repeatedly in production environments. Post your project for free →

Mohammed Yaseen
Founder, SolutionGigs
Mohammed has migrated production monitoring stacks from Datadog to Grafana and New Relic across B2B infrastructure products, including Kafka, Spark, and EMR pipelines. He writes about DevOps, cloud cost optimisation, and observability at solutiongigs.in. LinkedIn →