
Datadog Kafka Lag Monitoring: Setup, Metrics & Alerts
Last Updated: July 2026 | 14 min read
🔭 Part of our observability cluster. See also the pillar — Datadog Spark monitoring — and the free Datadog & Bits AI course.
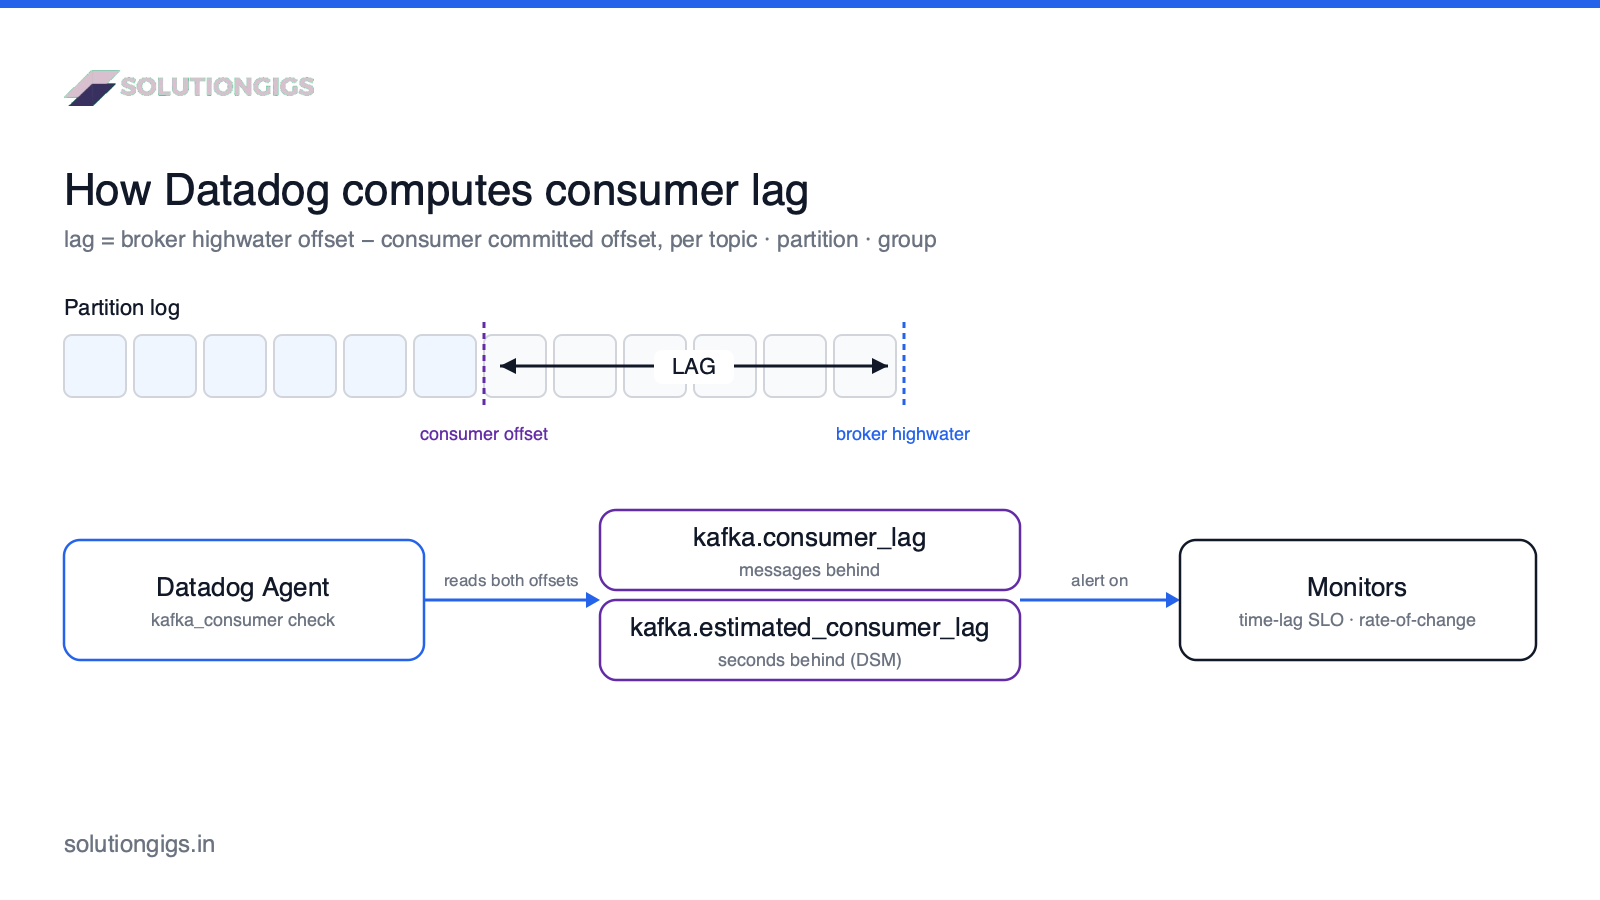
Quick Answer: Kafka consumer lag is how far behind a consumer is on a topic — and the cleanest way to monitor it in Datadog is the Agent's bundled kafka_consumer check. It fetches the broker highwater offset and each consumer's committed offset, then reports kafka.consumer_lag (lag in messages) tagged by topic, partition, and consumer_group. Enable Data Streams Monitoring and you also get kafka.estimated_consumer_lag (lag in seconds) — usually the better thing to alert on. The trap most teams fall into: alerting on an absolute message count, which pages them at 3 AM for a harmless post-deploy spike.
If you run Kafka, consumer lag is the single most important number you're not watching correctly. Most guides show you how to collect kafka.consumer_lag and stop there — leaving you with a metric that's noisy, easy to misread, and wired to an alert that either never fires or fires constantly. This guide fixes that: the difference between offset lag and time lag (and why it matters), the three ways to get lag into Datadog with honest trade-offs, the exact config, a dashboard that surfaces the real problem, and alerts that fire when something is actually wrong.
What Kafka consumer lag actually means
Consumer lag is the gap between the newest message on a partition and the last message a consumer has processed — measured either in messages (offset lag) or in seconds (time lag). Getting this distinction right is the whole game.
- Offset lag (
kafka.consumer_lag) =broker_offset − consumer_offset. "This consumer is 12,000 messages behind." Simple, always available, but contextless — 12,000 messages could be one second or one hour of data. - Time lag (
kafka.estimated_consumer_lag) = roughly how many seconds behind real-time the consumer is. This is what your business actually cares about: "our fraud pipeline is 4 minutes behind."
Key takeaway: offset lag tells you that you're behind; time lag tells you how much it matters. Whenever you can, set SLOs and page on time lag, and use offset lag for drill-down.
Lag grows for three reasons: the consumer is slower than the producer (under-provisioned), the consumer is stuck (a poison message, a rebalance loop, a downstream dependency), or there was a legitimate traffic burst. Your monitoring has to tell these apart — a job that's batch-vs-streaming mismatched will show lag that looks like an incident but is really an architecture choice.
Three ways to get Kafka lag into Datadog
For most teams the native kafka_consumer check is the right answer; Burrow and Kafka Lag Exporter solve narrower problems. Here's the honest comparison before you pick.
| Approach | What you get | Best when | Trade-off |
|---|---|---|---|
Datadog kafka_consumer check (native) |
kafka.consumer_lag (messages) + kafka.estimated_consumer_lag (seconds, via DSM), per topic/partition/group |
Almost everyone — it ships with the Agent | Offset lag only unless you enable Data Streams Monitoring |
| Burrow (LinkedIn) + Datadog integration | Sliding-window consumer status (OK / WARN / ERROR) instead of raw numbers | You want lag evaluation, not just a number | Extra service to run and monitor |
| Kafka Lag Exporter → OpenMetrics/Prometheus | Time lag in seconds as a first-class metric | You want time-lag but aren't on DSM | Prometheus/OpenMetrics plumbing to maintain |
There's also a fourth thing people confuse with this: the JMX Kafka Broker check (kafka). That collects broker-side throughput and JVM metrics — not consumer lag. You often want both, but don't expect lag from the broker check. For change-data-capture pipelines especially, pair lag with broker throughput — see CDC with Debezium and Kafka.
Recommendation: start with the native check, turn on Data Streams Monitoring for time lag, and only add Burrow or Kafka Lag Exporter if you have a specific reason. Every extra collector is another thing that can break at 3 AM.
Setting up the kafka_consumer check
The check is bundled with the Datadog Agent — create conf.d/kafka_consumer.d/conf.yaml, point it at your brokers, list the consumer groups, and restart. No install on the Kafka nodes themselves.
# /etc/datadog-agent/conf.d/kafka_consumer.d/conf.yaml
init_config:

instances:
  - kafka_connect_str:
      - broker1:9092
      - broker2:9092
    # Explicit groups/topics/partitions (empty list = all partitions)
    consumer_groups:
      fraud-scoring:
        transactions: []
      billing-etl:
        invoices: []
    # Optional: cluster-wide topic/partition/broker metrics
    enable_cluster_monitoring: false
    tags:
      - env:prod
      - kafka_cluster:payments
Confirm with sudo datadog-agent status and look for the kafka_consumer section reporting your groups with no errors.
Watch every group without hand-listing them
Maintaining consumer_groups by hand doesn't scale. Use a regex so new groups are picked up automatically:
    consumer_groups_regex:
      - '.*'          # monitor all groups; scope with a real pattern in prod
On Kubernetes: use a Cluster Check
On Kubernetes, run kafka_consumer as a Cluster Check so exactly one Agent queries the brokers. Running the same config on every node's Agent double-counts metrics and piles needless load on the cluster. Let the Cluster Agent schedule a single instance, pointed at the bootstrap service. This is the Kafka analogue of the driver-IP gotcha covered in the Spark monitoring guide — the platform changes where the check runs, not how it works.
Building a Kafka lag dashboard that surfaces the real problem
A good lag dashboard answers one question fast: which consumer group, on which topic, is falling behind — and is it getting worse? Structure it so an on-call engineer sees the answer in one glance.
- Top row — time lag by group:
kafka.estimated_consumer_lagas a timeseries, one line perconsumer_group. This is your headline health metric. - Second row — offset lag heatmap by partition:
kafka.consumer_laggrouped bypartition. Lag concentrated on one partition is a classic signature of key skew or a stuck partition — it looks completely different from uniform lag across all partitions. - Third row — lag trend / rate of change: the derivative of lag. Flat-but-high is a steady backlog; climbing is an active incident.
- Context row: consumer group
membersandrebalancingstatus (kafka.consumer_group.rebalancing) — a group stuck rebalancing will lag while looking "up."
Group everything by consumer_group, topic, and env. Avoid building the main board around per-partition series for high-partition topics — it's both unreadable and a cardinality cost (more on that in the upcoming high-cardinality deep-dive).
Alerting on lag without the 3 AM false pages
Alert on time lag against a data-freshness SLO, or on the rate of change of offset lag — never on a single absolute message count. Absolute thresholds are why teams either drown in false pages or miss real incidents.
- Best — time-lag SLO: alert when
kafka.estimated_consumer_lag > N secondsfor M minutes. "Page if the fraud pipeline is more than 2 minutes behind for 5 minutes." This maps to something a human actually cares about. - Good — rate of change: if you only have offset lag, alert on a change — lag increasing steadily over a rolling window — not on crossing a fixed number. A spike to 50k that drains in 30 seconds is fine; 50k that keeps climbing is not.
- Context, not page — rebalances: monitor
kafka.consumer_group.rebalancing; a group rebalancing in a loop will lag, but the fix is different, so treat it as a warning that explains the lag.
Tip: scope lag monitors per consumer group, not globally. A single "total lag" alert hides the one group that's actually broken behind the noise of dozens that are healthy.
Troubleshooting: zero, negative, or missing lag
- Lag shows zero for a real consumer. The group isn't in your
consumer_groups/regex, or offsets live somewhere the check isn't reading (Kafka vs ZooKeeper for old-style consumers). Verify withkafka-consumer-groups.sh --describe. - Lag goes negative. Datadog reads consumer offsets before broker offsets specifically to avoid this on fast topics; a negative value means messages were skipped, and the Agent emits an event tagged with
topic/partition/consumer_group. Investigate the consumer, don't just clamp it. - A partition is missing. Usually no consumer has committed an offset for it yet, or the partition is offline (
kafka.partition.offline). - Lag looks stuck at a flat number. Often the consumer is down entirely — pair the lag alert with a check on
kafka.consumer_group.members.
Common mistakes with Datadog Kafka lag monitoring
- Alerting on absolute offset lag. Guarantees either false pages or missed incidents — use time lag or rate of change.
- Running the check on every node. Double-counts metrics and pressures the cluster; use one Agent (or one Cluster Check).
- Ignoring time lag. Offset lag without seconds is contextless; enable Data Streams Monitoring.
- One global lag alert. Hides the single broken group behind healthy ones — alert per
consumer_group. - Confusing the broker (JMX) check with the consumer check. The broker check gives throughput, not lag.
- Forgetting rebalances. A rebalancing loop shows as lag; monitor
kafka.consumer_group.rebalancingso you know which problem you have.
Frequently Asked Questions
How do I monitor Kafka consumer lag with Datadog?
Enable the Agent's bundled kafka_consumer check by editing conf.d/kafka_consumer.d/conf.yaml with your kafka_connect_str and the consumer_groups to track. The check fetches the broker highwater offset and each consumer's committed offset, then reports lag as kafka.consumer_lag (in messages), tagged by topic, partition, and consumer_group. Run it on a single Agent that can reach the brokers.
What is the difference between offset lag and time lag in Kafka?
Offset lag is the number of messages behind — broker offset minus consumer offset — reported as kafka.consumer_lag. Time lag is how many seconds behind the consumer is, reported as kafka.estimated_consumer_lag via Data Streams Monitoring. Time lag is the better SLO because 10,000 messages means nothing until you know whether that's one second or one hour of data.
Why is my Datadog Kafka consumer lag showing zero or negative?
Zero usually means the group isn't listed in your config, offsets are stored where the check isn't looking (Kafka vs ZooKeeper), or the consumer truly caught up. Negative lag happens when broker offsets are read before consumer offsets on a fast topic; Datadog reads consumer offsets first to avoid it and emits an event when lag drops below zero. Confirm with datadog-agent status and kafka-consumer-groups.sh.
Which Datadog metric should I alert on for Kafka lag?
Alert on kafka.estimated_consumer_lag (seconds) when available, because it maps to a data-freshness SLO. If you only have kafka.consumer_lag (messages), alert on its rate of change or a sustained high value rather than a single absolute threshold — a brief spike after a deploy is normal, but lag climbing for several minutes means the consumer can't keep up.
Do I need Burrow or Kafka Lag Exporter with Datadog?
Usually not. The native kafka_consumer check gives you offset lag out of the box and time lag through Data Streams Monitoring. Use Burrow if you want its sliding-window OK/WARN/ERROR status evaluation, or Kafka Lag Exporter if you specifically want time lag pushed via Prometheus/OpenMetrics. For most teams the native check is simpler and one less thing to maintain.
How do I monitor Kafka consumer lag on Kubernetes with Datadog?
Run the kafka_consumer check as a Datadog Cluster Check so exactly one instance queries the brokers — avoiding duplicate load and double-counted metrics. Point kafka_connect_str at the bootstrap service, list your consumer_groups (or use a regex), and let the Cluster Agent schedule the single check.
Is Kafka consumer lag monitoring free in Datadog?
The kafka_consumer check ships with the Agent at no extra cost, but the metrics count toward your Datadog usage, and per-partition lag on high-partition topics can generate significant custom-metric volume. Group by consumer_group and topic for alerting, and reserve per-partition detail for focused dashboards to keep cardinality — and cost — under control.
Conclusion
Kafka lag monitoring in Datadog is easy to turn on and easy to get wrong: collect kafka.consumer_lag with the native check, enable Data Streams Monitoring for kafka.estimated_consumer_lag in seconds, and alert on time lag or rate-of-change per consumer group — not on a raw message count. Do that and lag stops being a scary number on a dashboard and becomes a real signal: this pipeline is this far behind, and it's getting better or worse. That's the difference between knowing your streaming platform is healthy and hoping it is.
This sits alongside the Spark monitoring pillar in our observability cluster — next up: Databricks monitoring and a deep-dive on taming Datadog high cardinality (where per-partition lag can quietly cost you). Running Kafka in production and want a second set of eyes? Get matched with a vetted data engineer on SolutionGigs — it's free to post a project.

Mohammed Yaseen
Founder, SolutionGigs
Mohammed runs Kafka-backed streaming pipelines in production and has wired consumer lag into Datadog — including the false-page alerts he had to unlearn. He teaches the free Learn Data Engineering course. LinkedIn →