
Datadog Spark Monitoring: The Metrics That Actually Matter
Last Updated: July 2026 | 16 min read
🔭 Part of our observability cluster. New to the platform? Start with the free Datadog & Bits AI course. Trying to cut your bill instead? See Datadog alternatives in 2026.
Quick Answer: Datadog Spark monitoring works through the Datadog Agent's bundled Spark check, which scrapes the Spark REST API on your driver, master, or YARN ResourceManager and forwards driver, executor, job, stage, and RDD metrics to Datadog. You enable it by editing conf.d/spark.d/conf.yaml with a spark_url, a spark_cluster_mode (spark_yarn_mode, spark_driver_mode, spark_standalone, or spark_mesos_mode), and a cluster_name tag — no extra install needed. The catch most people hit: the check only reports metrics while an app is actually running, and only a handful of the ~50 collected metrics are worth alerting on.
Most "Datadog Spark monitoring" guides stop at "paste this config, here's a dashboard." That gets you 50 metrics you don't understand and a bill you didn't expect. This guide is the one I wish existed when I first wired Spark on EMR into Datadog: the exact setup for YARN, EMR, and Kubernetes, the 8 metrics that actually predict a failed or slow job, the alerts worth paging on, and the cardinality trap that quietly inflates your custom-metrics cost. Everything here uses real metric names from the official Spark integration.
What Datadog can (and can't) see in Spark
Datadog sees everything the Spark REST API exposes about running applications — drivers, executors, jobs, stages, tasks, and RDDs — but it does not see anything when no application is running. That single fact explains most "why are my metrics missing?" tickets.
The Spark check is a scraper, not an agent embedded inside your job. It polls the Spark UI/REST endpoint (the same JSON behind the Spark Web UI) on a schedule and translates the response into Datadog metrics. This means:
- You get application-level health: executor memory, task counts, shuffle, GC time, job/stage success and failure, streaming throughput.
- You don't get JVM-level flame graphs or line-level profiling — that's a different tool. And crucially, between jobs there is nothing to scrape, so on a cluster that runs periodic batch jobs your metrics will be "spiky by design."
Key takeaway: if your Spark cluster runs short batch jobs, gaps in the graphs are normal — the check emits a health check when idle and metrics only while an app runs. Don't alert on "no data" the way you would for a long-lived service.
How Datadog Spark monitoring works
The Agent runs next to your Spark control plane, scrapes the Spark REST API, and ships metrics to Datadog tagged with your cluster_name. Understanding this data path is what makes the setup (and the debugging) obvious.
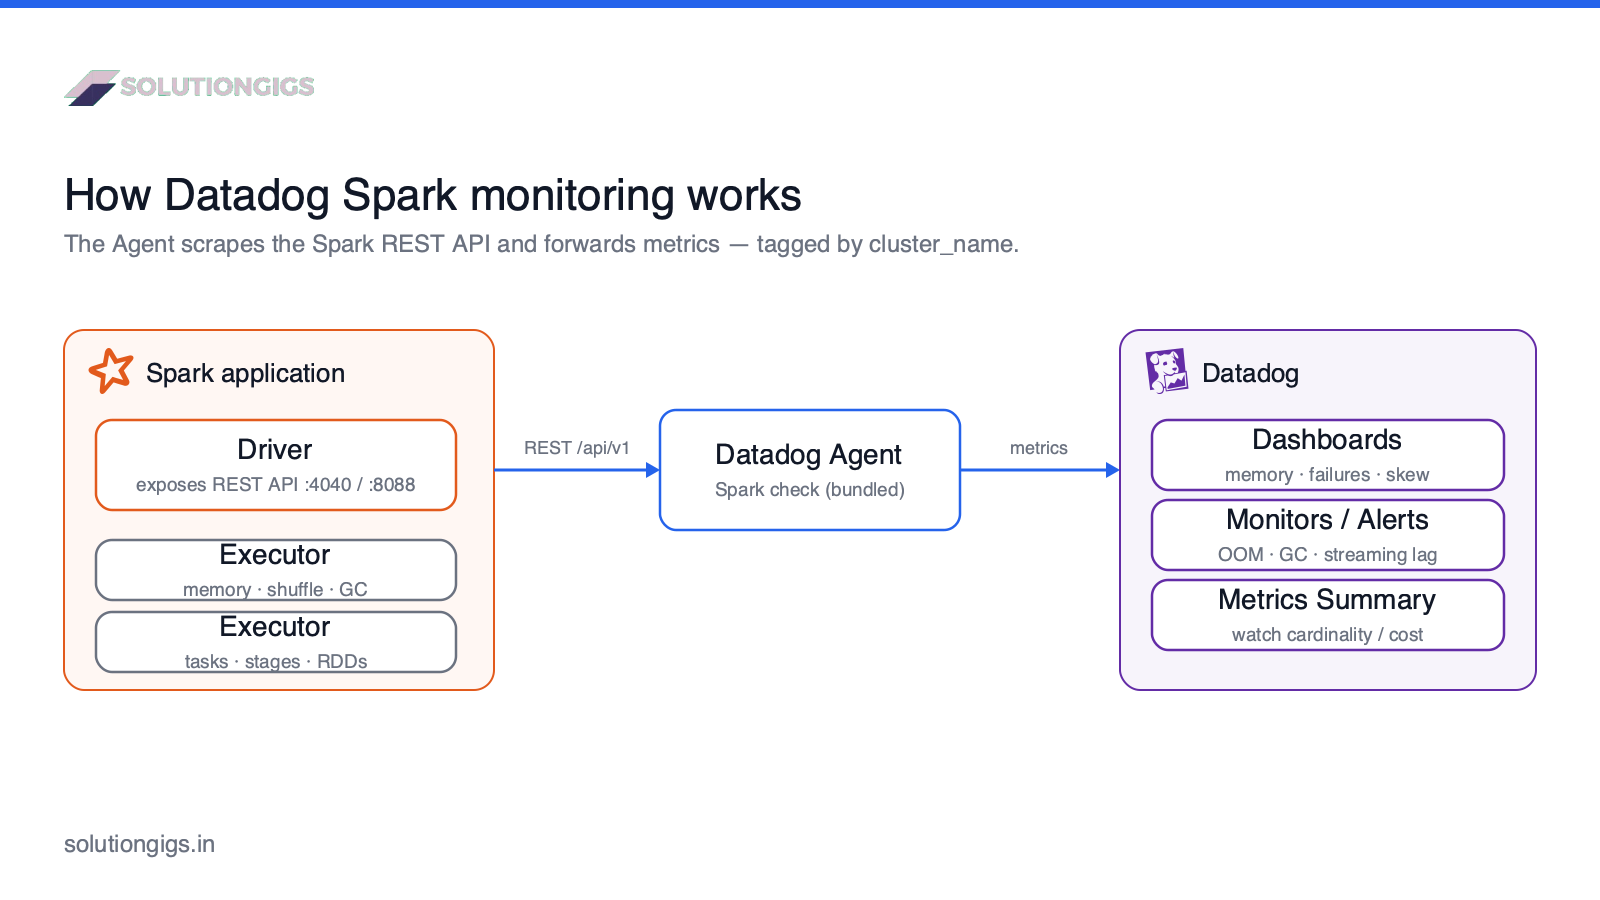
The flow is the same everywhere; only where the Agent lives changes per platform:
- Standalone → Agent on the Spark master (
spark_standalone, UI on:8080). - YARN / EMR → Agent on the node running the ResourceManager (
spark_yarn_mode, RM on:8088). - Driver mode → Agent alongside the driver (
spark_driver_mode, driver UI on:4040). - Kubernetes → Agent as a DaemonSet, discovering the driver pod via Autodiscovery.
Because it's a scrape, the golden rule of debugging is: can the Agent reach that URL? If curl $spark_url/api/v1/applications works from the Agent host, Datadog will see your apps. If it doesn't, no config flag will save you.
Setting up the Spark integration
The Spark check ships inside the Datadog Agent — you enable it by creating conf.d/spark.d/conf.yaml, then restarting the Agent. Here's the minimum viable config, then the per-platform specifics.
Standalone / driver mode
# /etc/datadog-agent/conf.d/spark.d/conf.yaml
init_config:

instances:
  - spark_url: http://localhost:8080      # Spark master web UI
    spark_cluster_mode: spark_standalone
    cluster_name: analytics-prod          # REQUIRED — tags every metric
    streaming_metrics: true               # collect DStream + Structured Streaming
Restart and confirm with sudo datadog-agent status — look for a spark section reporting instances: 1 and no errors.
YARN and AWS EMR
On EMR, install the Agent and configure the check with a bootstrap action, and run the Spark check only on the primary node (the one with the ResourceManager). Point spark_url at the RM host on port 8088:
instances:
  - spark_url: http://<resourcemanager-host>:8088
    spark_cluster_mode: spark_yarn_mode
    cluster_name: emr-etl-prod
    tags:
      - env:prod
A robust EMR bootstrap does two things: (1) install the Agent on every node, and (2) on the primary node only, template the ResourceManager hostname from yarn-site.xml into spark.d/conf.yaml. Datadog's EMR guide walks through the exact scripts. If you run Spark on EMR as part of a larger lakehouse, it pairs naturally with data engineering on AWS S3, EMR & Glue.
Kubernetes (the driver-IP gotcha)
On Kubernetes the driver pod gets a fresh IP on every run, so a hard-coded spark_url breaks immediately. This is the single most common Spark-on-Datadog failure, and the fix is Autodiscovery: annotate the driver pod so the Agent templates the check at runtime.
# Spark driver pod annotations
metadata:
  annotations:
    ad.datadoghq.com/spark.checks: |
      {
        "spark": {
          "init_config": {},
          "instances": [{
            "spark_url": "http://%%host%%:4040",
            "spark_cluster_mode": "spark_driver_mode",
            "cluster_name": "k8s-spark-prod"
          }]
        }
      }
Run the Datadog Agent as a DaemonSet and the Cluster Agent for pod metadata; %%host%% resolves to the driver pod's current IP. This is the piece the Datadog docs bury and every practitioner rediscovers the hard way.
The 8 Spark metrics that actually matter
Of the ~50 metrics the integration collects, eight predict almost every real incident: OOM, skew, GC storms, stalls, and failures. Build your dashboards and alerts around these; treat the rest as drill-down detail.
| Metric | What it tells you | Watch for |
|---|---|---|
spark.executor.memory_used / spark.executor.max_memory |
How close executors are to their memory ceiling | Ratio near 1.0 → imminent OOM |
spark.executor.peak_mem.major_gc_time |
Time lost to major garbage collection | Rising GC time → memory pressure, thrashing |
spark.executor.id.total_shuffle_write |
Shuffle volume per executor | One executor >> others → data skew |
spark.stage.num_failed_tasks |
Task failures within a stage | Any sustained non-zero value |
spark.job.num_failed_tasks |
Failures rolled up to the job | Early warning before a job dies |
spark.stage.num_active_tasks |
Tasks currently running in a stage | Flat for a long time → stall |
spark.executor.disk_used |
Spill to disk | Growth → shuffle/spill, undersized memory |
spark.structured_streaming.latency |
End-to-end batch latency (streaming) | Rising → falling behind input rate |
Why these and not the rest
- OOM is the #1 Spark killer.
memory_usedvsmax_memoryis your leading indicator; by the time the driver logs anOutOfMemoryError, you're already down. Watching the ratio lets you catch it while there's still time to repartition or bump executor memory. - Skew hides in shuffle. Averages lie — one executor writing 10× the shuffle of its peers is the signature of a skewed key. This connects directly to how you partition your data; most skew is a partitioning problem wearing a monitoring costume.
- Stalls look like health. A job with
num_active_taskspinned at a low number for minutes isn't "running," it's stuck — usually on a straggler or a lock. Absolute task counts don't page; flat over time does.
For streaming pipelines, spark.structured_streaming.processing_rate versus your input rate is the Spark analogue of Kafka consumer lag — if processing can't keep up, latency climbs until the pipeline falls over. (A dedicated Kafka lag guide is coming next in this cluster.)
Building a Spark dashboard worth looking at
A useful Spark dashboard answers three questions in one screen: is the cluster healthy, is any job failing, and is any job about to run out of memory? Structure it top-to-bottom by blast radius.
- Cluster header (top row): active applications, total executors, aggregate
spark.executor.memory_usedvsmax_memory. One glance = "are we OK?" - Failures (second row):
spark.stage.num_failed_tasksandspark.job.num_failed_tasksas timeseries, grouped bycluster_name. Non-zero should be visually loud. - Memory & GC (third row): per-executor
memory_usedandmajor_gc_time. Use a top-list widget so the worst executor surfaces itself. - Shuffle & skew (fourth row):
total_shuffle_writeper executor as a heatmap — skew shows up instantly as one hot row. - Streaming (if applicable):
structured_streaming.latencyandprocessing_rateagainst input rate.
Group everything by cluster_name and env so one dashboard serves every cluster. Avoid grouping by application_id on the main board — it's high-churn and both clutters the view and (as we'll see) can cost you money.
Alerts worth paging on
Alert on the failure and resource-exhaustion signals, use rate-of-change not absolutes for noisy metrics, and never page on "no data" for a batch cluster. Four monitors cover 90% of real Spark incidents:
- Executor OOM risk — alert when
avg(spark.executor.memory_used) / avg(spark.executor.max_memory) > 0.9for 5 minutes. Warns before the crash. - Job failures — alert when
spark.job.num_failed_tasks > 0sustained; page on stage/job death. - GC storm — alert when
spark.executor.peak_mem.major_gc_timerises sharply (use a change alert, not a fixed threshold — heap sizes differ per job). - Streaming fell behind — alert when
spark.structured_streaming.latencyexceeds your batch interval for N consecutive batches.
Tip: For batch clusters, scope monitors with "do not notify on missing data." The check legitimately stops emitting between jobs, so a naive no-data alert will page you every night for a cluster that's perfectly healthy.
The cost trap nobody warns you about
Spark monitoring can quietly balloon your Datadog bill through high cardinality — every unique tag combination on a metric is billed as a separate custom metric. Spark is a cardinality minefield because it naturally produces ephemeral identifiers: application_id, executor id, stage_id, job_id. Tag a metric by any of those and each run mints brand-new metric series that you pay for and never look at again.
A concrete example: tag spark.executor.memory_used by application_id, and a cluster running 500 jobs/day generates 500 new tag values per day — tens of thousands of custom metrics per month from one metric name.
Do this instead:
- Tag by stable dimensions:
cluster_name,env, and a logical job name you control (e.g.job:nightly_sessionization), not the Spark-assignedapplication_id. - Keep ephemeral IDs (executor id, application_id) available for short-term dashboards but exclude them from long-retention custom metrics where you can.
- Audit with Datadog's Metrics Summary and Estimated Usage to find which Spark metrics carry the most tag values — the offenders are almost always the ones tagged by an ID.
This is the same mechanism that makes people rage-quit Datadog over surprise bills; a dedicated deep-dive on high cardinality is next in this cluster. If cost is your primary concern, weigh it against Datadog alternatives in 2026 before you scale monitoring across every cluster.
Common mistakes with Datadog Spark monitoring
- Hard-coding
spark_urlon Kubernetes. The driver IP changes every run — use Autodiscovery. - Alerting on "no data" for batch clusters. The check stops emitting between jobs by design.
- Tagging metrics by
application_id. Instant cardinality explosion and a bloated bill. - Watching averages for skew. Skew hides in the distribution — use per-executor top-lists and heatmaps.
- Running the Spark check on every EMR node. Run it only on the primary/ResourceManager node; other nodes just need the Agent.
- Forgetting
streaming_metrics: true. Structured Streaming metrics are off by default, so your streaming latency graph stays empty and you never notice you're falling behind.
Frequently Asked Questions
How do I monitor Apache Spark with Datadog?
Install the Datadog Agent on the node running the Spark master, YARN ResourceManager, or driver, then enable the bundled Spark check by editing conf.d/spark.d/conf.yaml with your spark_url, spark_cluster_mode, and a cluster_name tag. The Agent scrapes the Spark REST API and forwards driver, executor, job, stage, and RDD metrics to Datadog. The check ships with the Agent, so there's nothing extra to install.
Why is Datadog not collecting my Spark metrics?
The most common cause is that the Spark integration only collects metrics about running applications — with no app running, the check submits only a health check and no metrics. Other causes: a wrong spark_url the Agent can't reach, the wrong spark_cluster_mode, or on Kubernetes the driver pod IP changing each run. Run datadog-agent status and read the spark section for the actual connection error.
What are the most important Spark metrics to monitor in Datadog?
The metrics that predict failures are spark.executor.memory_used and spark.executor.max_memory (OOM risk), spark.executor.peak_mem.major_gc_time (GC pressure), spark.executor.id.total_shuffle_write (skew), spark.stage.num_failed_tasks and spark.job.num_failed_tasks (failures), and spark.stage.num_active_tasks (stalls). For streaming, watch spark.structured_streaming.latency and processing_rate. The other ~40 metrics are mostly drill-down detail.
Does Datadog support Spark Structured Streaming?
Yes. Set streaming_metrics: true in the Spark check config to collect DStream (spark.streaming.statistics.*) and Structured Streaming (spark.structured_streaming.*) metrics such as latency, processing_rate, and input rows. These let you watch end-to-end batch latency and whether processing keeps up with the input rate — the streaming equivalent of consumer lag.
How do I monitor Spark on Kubernetes with Datadog?
Because the driver pod IP is assigned dynamically, you can't hard-code spark_url. Use Autodiscovery: add ad.datadoghq.com annotations to the driver pod that template the Spark check with %%host%%, so the Agent resolves the driver's address at runtime. Run the Agent as a DaemonSet and the Cluster Agent for pod metadata.
Does Spark monitoring increase my Datadog custom metrics bill?
It can. Spark emits per-executor and per-application metrics, and tagging by high-churn values like application_id, executor id, or stage_id turns each unique combination into a separate custom metric — cardinality and cost explode together. Tag by stable dimensions (cluster_name, env, logical job name) and audit with Datadog's Metrics Summary to catch offenders.
Is the Datadog Spark integration free?
The Spark check itself ships with the Datadog Agent at no extra charge, but the metrics it produces count toward your Datadog usage — infrastructure host billing plus any custom metrics from high-cardinality tags. The integration is free; the volume of data you send is what you pay for, which is exactly why the tagging discipline above matters.
Conclusion
Good Datadog Spark monitoring isn't about collecting more metrics — it's about watching the eight that predict OOM, skew, GC storms, stalls, and failures, wiring four sane alerts, and keeping your tags clean so the bill doesn't surprise you. Get the Agent onto the right node, point the Spark check at a URL it can actually reach, turn on streaming_metrics if you stream, and build dashboards grouped by cluster_name rather than ephemeral IDs. Do that and Spark stops being a black box that fails at 3 AM and becomes a system you can see into.
This is the pillar of our observability cluster — next up: Kafka lag monitoring, Databricks monitoring, and a deep-dive on taming Datadog high cardinality. Building or fixing a data platform right now? Get matched with a vetted data engineer on SolutionGigs — it's free to post a project.

Mohammed Yaseen
Founder, SolutionGigs
Mohammed runs production Spark on EMR and Kubernetes and has wired both into Datadog — including the 3 AM OOM pages and the surprise cardinality bills. He teaches the free Learn Data Engineering course. LinkedIn →