
Datadog Databricks Monitoring: Setup, Metrics & Cost
Last Updated: July 2026 | 15 min read
🔭 Part of our observability cluster. Databricks runs Spark, so pair this with the pillar — Datadog Spark monitoring — and the free Datadog & Bits AI course.
Quick Answer: Monitoring Databricks with Datadog takes two integrations, and most teams need both. (1) An in-cluster Agent, installed with a Databricks init script, runs on the driver and uses the Spark integration in driver mode to collect Spark job/stage/executor metrics, node CPU/memory, and driver logs (including OOM stack traces). (2) An account-level integration, connected with an OAuth service principal, reads jobs, cost/DBU, and model serving metrics from Databricks System Tables — no Agent required. The Agent tells you why a job was slow; the account integration tells you what it cost and whether it succeeded.
Almost every "monitor Databricks with Datadog" guide describes one of these two integrations and calls it done — which is why people set up the Agent, then wonder why they can't see cost, or connect the API tile and wonder why they can't debug an OOM. This guide covers both, how they fit together, and the cost trap (idle clusters) that the Databricks UI hides from you. Databricks runs on Apache Spark, so the metrics here build directly on the Spark monitoring pillar.
Why the Databricks UI isn't enough
The Databricks UI shows you one cluster or one job run at a time, with short retention and no alerting — Datadog gives you every cluster, trended and alertable, in one place. The UI is fine for looking at a job; it's useless for operating a platform.
Concretely, the native UI can't:
- Alert you when a nightly job's duration doubles or its failure rate climbs.
- Show memory pressure across every cluster over the last month.
- Attribute DBU cost to a team, job, or cluster so you can chargeback or cut waste.
- Correlate a slow job with the executor OOM or shuffle skew that caused it.
That's the gap Datadog fills — and it fills it from two directions.
The two integrations you actually need
Databricks monitoring in Datadog is split across an in-cluster Agent and an account-level API integration; they see completely different things. Understanding the split is what stops you from wiring up half a solution.
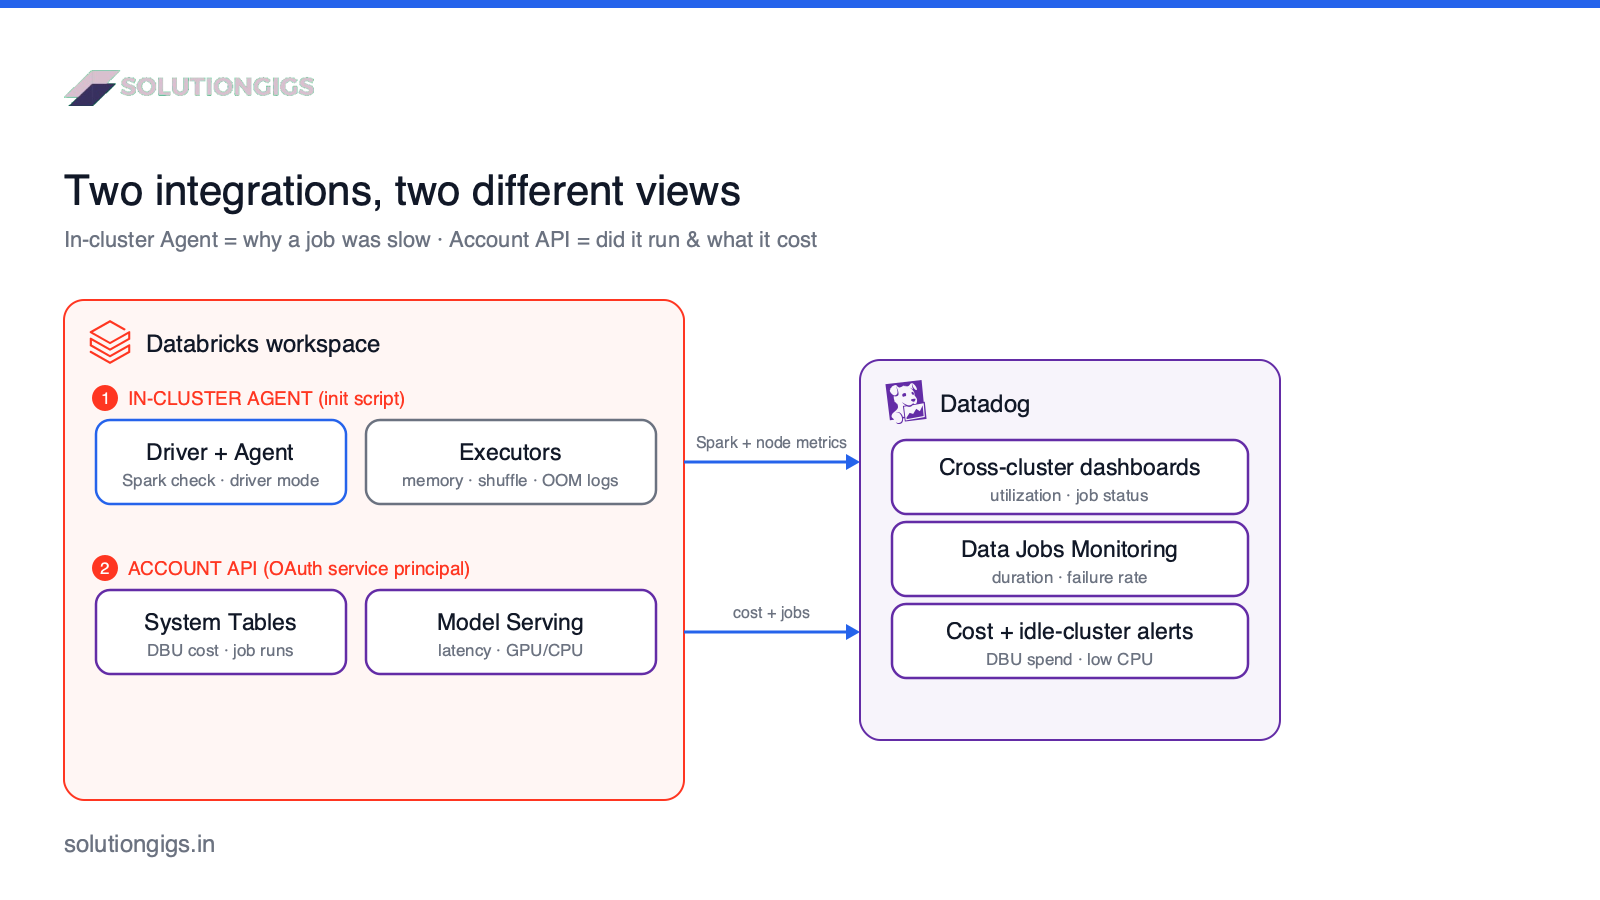
| Layer | How it connects | What it sees | What it can't see |
|---|---|---|---|
| In-cluster Agent | Init script installs the Agent on the driver | Spark job/stage/executor metrics, node CPU/mem/disk, driver & executor logs (OOM traces) | Cost/DBU, cross-cluster job history |
| Account-level API | OAuth service principal + System Tables | Jobs & workflow runs, DBU cost, model serving, workspace metadata | Live in-cluster Spark internals, logs |
Key takeaway: the Agent answers "why was this job slow / why did it OOM?" The account integration answers "did it run, how long, and what did it cost?" You almost always want both.
Installing the Agent with an init script
The Agent gets onto a Databricks cluster through an init script — either a global one Datadog manages for you, or a cluster-scoped one you generate from a notebook. The Agent runs on the driver and scrapes the Spark REST API in driver mode, so you don't install anything on the workers.
Option A — Datadog-managed global init script (recommended). In the Databricks integration tile, let Datadog install and manage a global init script for the workspace. It requires a Databricks access token (or OAuth service principal) with workspace admin. Every cluster in the workspace then starts with the Agent attached.
⚠️ Gotcha: global init scripts don't run on clusters in Standard access mode — a real limitation Databricks imposes, not a Datadog bug. For those clusters, use a cluster-scoped script.
Option B — manual cluster-scoped script. Run Datadog's provided notebook to generate an install script, store it in your workspace, and attach it under the cluster's Advanced options → Init Scripts. The script installs the Agent, sets DD_API_KEY and DD_SITE, and enables the Spark check in spark_driver_mode. Keep the API key in a Databricks secret, never inline:
# Cluster init script (conceptual) — installs the Agent on the driver
DD_API_KEY="{{secrets/datadog/api_key}}" \
DD_SITE="datadoghq.com" \
bash -c "$(curl -L https://install.datadoghq.com/scripts/install_script_agent7.sh)"
# The generated script also drops conf.d/spark.d/conf.yaml in driver mode
Because this is the Spark integration underneath, everything in the Spark monitoring guide applies — the same spark.executor.memory_used, spark.stage.num_failed_tasks, and shuffle metrics, now tagged per Databricks cluster.
Connecting the account-level integration (and cost)
Databricks cost and job history live in Unity Catalog System Tables, and only the account-level integration can read them. This is the half everyone forgets, and it's where the money is.
Set up an OAuth service principal (required for workspaces created after July 7, 2025 — personal access tokens are legacy), add it to Datadog's Databricks tile, and grant it read access to the system catalog:
GRANT USE CATALOG ON CATALOG system TO `<service_principal>`;
GRANT SELECT   ON CATALOG system TO `<service_principal>`;
-- plus CAN USE on a SQL Warehouse the integration can query
With that in place, Datadog's Data Jobs Monitoring and Cloud Cost Management ingest DBU consumption and cloud spend, and Reference Tables enrich your metrics with workspace names, job definitions, and cluster configs. Now you can answer "which team's jobs cost the most" — which is the whole point of watching cost.
What to monitor (and the idle-cluster trap)
Watch four things: cluster resource health, Spark job outcomes, job run duration/failures, and DBU cost — with idle clusters as the single highest-ROI alert. Here's the priority order.
- Cluster utilization — node CPU, memory, and disk (tagged by cluster and node type). Chronically low utilization = oversized clusters burning DBUs; chronically high = jobs about to OOM.
- Spark job health —
spark.job.countbroken down by status (failed/succeeded), plus the executor memory and shuffle metrics from the Spark pillar. This is your "is anything failing right now" signal. - Job run duration & failure rate — from Data Jobs Monitoring. A nightly job creeping from 20 to 45 minutes is a cost and SLA problem you'll only catch by trending it.
- DBU cost — from System Tables. The classic waste is idle interactive clusters left running overnight; a single always-on cluster nobody shut down can quietly dwarf your job costs.
The idle-cluster trap: the Databricks UI won't nag you about a cluster sitting idle at 3% CPU for 14 hours — but you pay DBUs the whole time. A Datadog monitor on low utilization + uptime is often the fastest monitoring ROI a Databricks shop will ever get.
Dashboards and alerts worth setting
Build one cross-cluster overview and four monitors: failed jobs, OOM risk, runaway duration, and idle spend. Keep it lean.
- Overview dashboard: active clusters, aggregate CPU/mem utilization,
spark.job.countby status, and DBU spend trend — the whole platform on one screen. - Failed jobs — alert on
spark.job.count{status:failed}or Data Jobs Monitoring failure rate, per job. - Executor OOM risk — alert when
spark.executor.memory_used / spark.executor.max_memory > 0.9(same monitor as the Spark pillar, scoped by cluster). - Runaway duration — use anomaly detection on job run duration so a job that suddenly takes 2× its historical time pages you, without a brittle fixed threshold.
- Idle spend — alert when a cluster's CPU stays below a floor (e.g. <5%) for a sustained window while still running.
For a deeper build-vs-buy view on the cost side, weigh Databricks-plus-Datadog spend against Datadog alternatives in 2026, and if you're still choosing a platform, see Databricks vs AWS EMR.
Common mistakes with Datadog Databricks monitoring
- Setting up only one integration. Agent-only = no cost visibility; API-only = can't debug OOMs. Do both.
- Expecting global init scripts to work on Standard access mode clusters. They don't — use cluster-scoped scripts there.
- Inlining the Datadog API key in the init script. Use a Databricks secret.
- Ignoring idle clusters. The biggest, easiest Databricks cost win, and the UI stays silent about it.
- Installing the Agent on every worker. Driver mode collects executor metrics from the Spark REST API; the driver Agent is enough.
- Tagging cluster metrics by
cluster_id/run_id. Ephemeral IDs explode cardinality and cost — tag by stable cluster name, env, and job name.
Frequently Asked Questions
How do I monitor Databricks with Datadog?
There are two integrations and most teams need both. Install the Datadog Agent on your clusters with an init script — Datadog can manage a global init script, or you generate a cluster-scoped one from a notebook. The Agent runs on the driver and uses the Spark integration in driver mode to collect Spark and node metrics. Then connect the account-level integration via an OAuth service principal to pull jobs, cost/DBU, and model serving from Databricks System Tables.
Why isn't the Databricks UI enough for monitoring?
The UI shows one cluster or job run at a time, with short retention and no cross-cluster alerting. It can't page you when a nightly job's duration doubles, trend memory pressure across every cluster, or attribute DBU cost to teams. Datadog centralizes Spark metrics, node resources, job outcomes, and cost into persistent, alertable dashboards spanning every cluster.
How do I install the Datadog Agent on a Databricks cluster?
Use an init script. The recommended path is letting Datadog install and manage a global init script (requires a Databricks token or OAuth service principal with workspace admin). Alternatively, run Datadog's notebook to generate a cluster-scoped init script and attach it under the cluster's Advanced options. The script installs the Agent on the driver, sets DD_API_KEY and DD_SITE, and enables the Spark check in driver mode. Global init scripts don't work on Standard access mode clusters.
How do I track Databricks cost (DBU) in Datadog?
DBU cost lives in Unity Catalog System Tables, not in Spark metrics. Connect the account-level integration with an OAuth service principal, grant it USE CATALOG and SELECT on the system catalog plus CAN USE on a SQL Warehouse, and Datadog reads DBU consumption and cloud spend into Cloud Cost Management and Data Jobs Monitoring. That's what lets you catch idle clusters and attribute cost by job or team.
Does Datadog monitor Databricks jobs and workflows?
Yes, via Data Jobs Monitoring. It surfaces problematic jobs and workflows, tracks run duration and failure rates, and helps optimize cluster resources, drawing from System Tables and event logs. Combined with in-cluster Spark metrics from the Agent, you get both the "did this run succeed and how long did it take" view and the "what happened inside the cluster" view.
Do I need the Datadog Agent if I use the account-level integration?
They cover different things. The account-level API integration gives jobs, cost/DBU, model serving, and workspace metadata with no Agent. The in-cluster Agent gives real-time Spark job/stage/executor metrics, node CPU/memory, and driver/executor logs including OOM traces. If you only care about cost and outcomes, the API is enough; to debug why a job was slow or OOM'd, you need the Agent too.
Does Databricks monitoring increase my Datadog bill?
It can, in two ways: infrastructure host billing for the Agent on each driver, and custom-metric cardinality if you tag Spark metrics by ephemeral cluster_id or run_id. Tag by stable dimensions (cluster name, env, logical job name) and reserve per-run detail for focused dashboards. The cost visibility you gain usually pays for the monitoring several times over by exposing idle clusters.
Conclusion
Good Databricks monitoring in Datadog is two integrations working together: the in-cluster Agent (init script, driver mode) for real-time Spark and node health, and the account-level API (OAuth + System Tables) for jobs and DBU cost. Wire up both, tag by stable dimensions, and set the idle-cluster alert first — it's the fastest way to turn monitoring from a cost into a saving. Then Databricks stops being a UI you check after something breaks and becomes a platform you can actually operate.
This sits alongside the Spark monitoring pillar and Kafka lag monitoring in our observability cluster — next up: a deep-dive on taming Datadog high cardinality (where those ephemeral cluster IDs quietly cost you). Running Databricks in production and want a second set of eyes? Get matched with a vetted data engineer on SolutionGigs — it's free to post a project.

Mohammed Yaseen
Founder, SolutionGigs
Mohammed runs production Databricks workloads and has wired both the in-cluster Agent and the account-level cost integration into Datadog — including the idle-cluster alert that paid for itself in a week. He teaches the free Learn Data Engineering course. LinkedIn →