
Datadog Agent Not Reporting? The Ordered Fix Guide
Last Updated: July 2026 | 12 min read
🔭 Part of our observability cluster. When the Agent is fine but the metrics are wrong, see Datadog Spark monitoring and Kafka lag monitoring, or start with the free Datadog & Bits AI course.
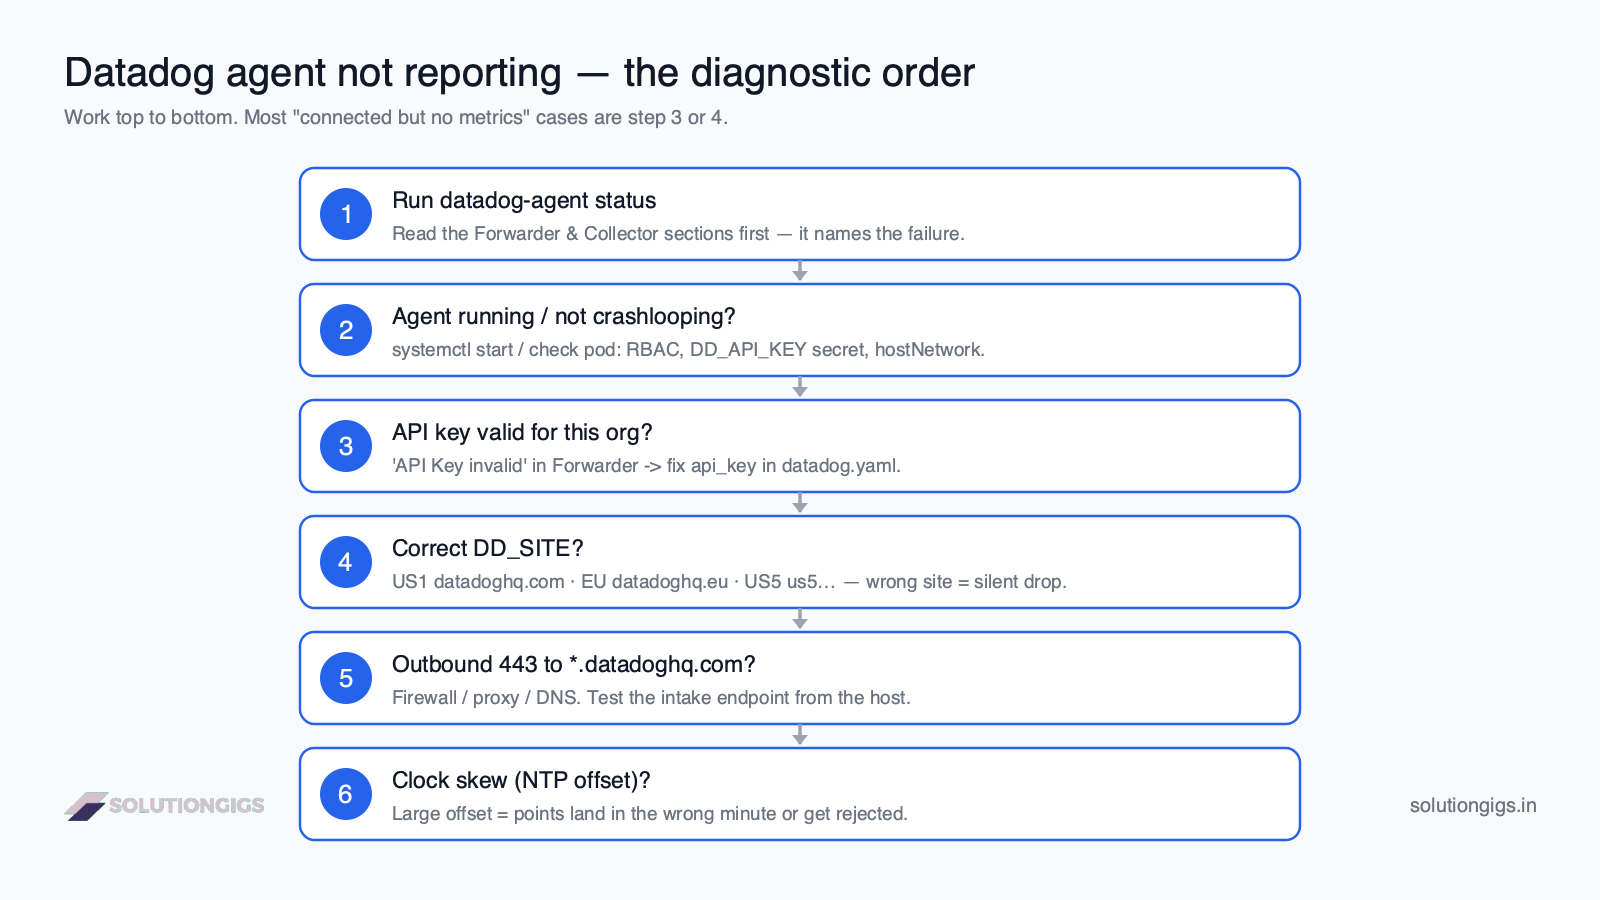
Quick Answer: When the Datadog agent is not reporting, work the causes in order instead of guessing — the fix is almost always one of six things. Run datadog-agent status first and read the Forwarder section: (1) is the Agent even running / not crashlooping, (2) is the API key valid, (3) is DD_SITE the site your org actually lives on (US1 datadoghq.com vs EU datadoghq.eu vs US5…), (4) can the host reach *.datadoghq.com on port 443 (firewall/proxy/DNS), (5) is there clock skew (NTP offset), and (6) are you hitting cardinality/quota limits. The single most common "connected but no metrics" cause is an invalid API key or a wrong site — both look healthy until you read the Forwarder output.
"My Datadog agent isn't sending metrics" is one of the highest-intent, most-searched Datadog problems — and most guides answer it with an unordered pile of things to check. This one gives you a diagnostic order: the exact command to run, the failure signature to look for, and the fix, top to bottom. Follow it and you'll usually be reporting again within a few minutes, without a support ticket. Datadog is the observability platform we cover across our monitoring guides; this is the troubleshooting companion.
First: run datadog-agent status and read it correctly
Before changing anything, run the status command — it names the failure for you. Ninety percent of "agent not reporting" cases are diagnosed from this one output; people skip it and start editing config blindly.
sudo datadog-agent status          # host install (Linux)
agent status                       # inside a container
kubectl exec <datadog-pod> -- agent status   # Kubernetes
Read these three sections, in this order:
- Forwarder — the truth about whether data is leaving the host. Look at
Transactions(areSuccesscounts climbing, or areErrors/Droppedclimbing?) and anyAPI Keysstatus line. A healthy Agent shows successful transactions and a valid key. - API Keys — an explicit
API Key ending with xxxxx: API Key valid(orinvalid). - Collector → Running Checks — each integration with
[OK]or an error. If your check isn't even listed, the config isn't being loaded.
Key insight: the Agent process running is not the same as the Agent reporting.
systemctl statuscan say "active (running)" while every payload is rejected at the intake. The Forwarder section — not the service status — tells you if metrics are actually landing.
Step 1 — Is the Agent actually running (and not crashlooping)?
If status errors out or the service is dead, the Agent isn't collecting anything — start there. On a host, confirm and restart:
sudo systemctl status datadog-agent
sudo systemctl restart datadog-agent
sudo datadog-agent health           # returns "Agent health: PASS" when healthy
In Kubernetes, a silent "no metrics" is often a pod stuck restarting:
kubectl get pods -l app=datadog-agent
kubectl describe pod <datadog-pod>   # look at Events / Last State for the restart reason
kubectl logs <datadog-pod> --previous
The classic Kubernetes crashloop causes are a missing DD_API_KEY secret, missing RBAC (the Agent can't reach the kubelet/API server), or a failing NTP check. Fix the pod first — you can't debug reporting on an Agent that won't stay up.
Step 2 — Is the API key valid for this organization?
An invalid or mismatched API key is the number-one reason a running Agent reports nothing. The status Forwarder will say API Key invalid. This happens when the key was revoked, copied with a trailing space, or belongs to a different Datadog org than the one you're looking at.
# /etc/datadog-agent/datadog.yaml
api_key: <paste a valid key from Organization Settings → API Keys>
Then restart the Agent and re-check status. Two things people miss:
- The key must belong to the same org whose UI you're checking. Keys are not portable across orgs.
- In containers, the env var
DD_API_KEYoverrides the file — a stale value in your Helm values or Deployment wins over a correctdatadog.yaml.
Step 3 — Is DD_SITE pointing at the right Datadog region?
A correct API key sent to the wrong site is rejected — and it's an easy mistake because the default is US1. Datadog runs multiple regional intakes, and the Agent ships to whichever site you set:
| Site | site / DD_SITE value |
Web URL |
|---|---|---|
| US1 (default) | datadoghq.com |
app.datadoghq.com |
| US3 | us3.datadoghq.com |
us3.datadoghq.com |
| US5 | us5.datadoghq.com |
us5.datadoghq.com |
| EU1 | datadoghq.eu |
app.datadoghq.eu |
| AP1 | ap1.datadoghq.com |
ap1.datadoghq.com |
| US1-FED | ddog-gov.com |
app.ddog-gov.com |
Set it to match the domain in your Datadog URL, then restart:
# /etc/datadog-agent/datadog.yaml
site: datadoghq.eu    # example: an EU org — the #1 silent-drop mistake
Fastest tell: if your browser address bar says
app.datadoghq.eubut your Agent config has nosite(so it defaults todatadoghq.com), that's your bug. The key is "valid" in EU and "invalid" in US1.
Step 4 — Can the host actually reach Datadog on port 443?
If the Agent can't open an outbound TLS connection to the intake, the Forwarder piles up errors and nothing reports. Datadog uses outbound port 443 to *.datadoghq.com (or your site's domain). Test it from the host itself — not your laptop:
# Does the host resolve and reach the intake? (swap the domain for your site)
curl -v https://api.datadoghq.com/ 2>&1 | head -20
# Proxy environments: confirm the Agent's proxy config, not just the shell's
Common blockers:
- Firewall / security group dropping egress on 443 to Datadog ranges.
- Corporate proxy the shell knows about but the Agent doesn't — set
proxyindatadog.yaml. - DNS failing to resolve the intake host on locked-down networks.
Step 5 — Is clock skew (NTP) breaking your timestamps?
A large NTP offset makes the Agent drop metrics or drop them into the wrong minute, so they look "missing." Datadog's built-in NTP check exists precisely because time drift silently corrupts reporting. The status output will show an NTP offset; if it's large, sync the clock:
timedatectl        # is NTP synchronized? what's the offset?
sudo chronyc makestep   # or: sudo ntpdate pool.ntp.org
In cloud VMs and Kubernetes this shows up when the node's NTP servers are unreachable — you'll see Failed to get clock offset from any ntp host in the NTP check. Point the check at a reachable server or set use_local_defined_servers: true so it uses the host's own NTP config.
Step 6 — Are you hitting cardinality or quota limits?
If everything above is green but some metrics are missing, you may be over a custom-metrics or tag-cardinality limit and Datadog is dropping the overflow. High-cardinality tags (a unique user_id, request_id, or ephemeral pod/run_id on every point) can breach limits and silently truncate data.
This is the failure mode that ties the whole observability cluster together — Spark and Kafka pipelines are common offenders because per-partition and per-job tags explode. If your "missing metrics" are really "missing some series," audit your tags and prune the high-cardinality ones. (A dedicated deep-dive on taming Datadog high cardinality is next in this series.)
Still stuck? Generate a flare
When you've worked the order and it's still dark, send Datadog a flare instead of guessing further. It packages config, logs, and status — with secrets scrubbed — into a support ticket:
sudo datadog-agent flare <ticket-number>
Attach your datadog-agent status output too. At that point you've eliminated the six common causes, so support can focus on the genuinely unusual one.
Common mistakes that waste an hour
- Editing config without restarting. Every
datadog.yamlchange needssystemctl restart datadog-agent(or a pod restart) to take effect. - Trusting
systemctl statusover the Forwarder. "active (running)" ≠ "reporting." - Assuming the default site. If your org is EU/US3/US5, the default
datadoghq.comsilently rejects everything. DD_API_KEYenv var shadowing a correct file. In containers the env wins — fix it there.- Running two Agents on one host. They fight over sockets/config; keep exactly one.
- Debugging reporting on a crashlooping pod. Get the pod stable first, then look at metrics.
Frequently Asked Questions
Why is my Datadog agent connected but not reporting metrics?
A running Agent that sends nothing almost always fails silently at the API key or the site. Run datadog-agent status and read the Forwarder section: an API Key invalid error, or a DD_SITE that points at a different region than your org (US1 vs EU vs US5), means the process is healthy but every payload is rejected at intake. Fix the key and site, restart, and confirm the Forwarder shows successful transactions.
How do I check if the Datadog agent is working?
Run sudo datadog-agent status (or agent status in a container). Read the Forwarder (are transactions succeeding, is the API key valid), then Collector → Running Checks (do your integrations show [OK]). Successful transactions plus [OK] checks means it's reporting. Failed transactions or an invalid key means the Agent runs locally but nothing reaches Datadog.
What does 'API Key invalid' mean in Datadog agent status?
It means the api_key in datadog.yaml (or the DD_API_KEY env var) is wrong, revoked, or belongs to a different org or site than the one you're viewing. The Agent still starts and runs checks, but the intake rejects every payload, so no metrics appear. Copy a valid key from Organization Settings → API Keys for the correct org, set it, restart, and verify DD_SITE matches that org.
Does the wrong DD_SITE stop Datadog from receiving metrics?
Yes. DD_SITE selects the regional intake — US1 is datadoghq.com, EU is datadoghq.eu, plus US3/US5/AP1/US1-FED. If the Agent's site doesn't match where your account lives, the key is rejected or data goes to a region you never check, so metrics never show up. Set site in datadog.yaml to exactly the domain in your Datadog URL and restart.
Why is the Datadog agent not sending metrics from Kubernetes?
Usual causes: a CrashLoopBackOff pod (missing RBAC, missing DD_API_KEY secret, or failing kubelet connection), NTP/clock skew on the node, or the Agent being unable to reach the intake. Run kubectl get pods, then kubectl describe pod and kubectl logs --previous for the restart reason, then exec in and run agent status. A large NTP offset alone can also cause dropped metrics.
How do I generate a Datadog agent flare for support?
Run sudo datadog-agent flare <case-id> (or agent flare in a container). It bundles config, recent logs, and status output with secrets scrubbed, and uploads it to support. Generate it after you've worked the diagnostic order and are still stuck — attaching the flare plus your status output is the fastest path to a fix.
How long does it take for metrics to appear after fixing the agent?
Once the Forwarder shows successful transactions, metrics typically appear in dashboards within a minute or two. If status is healthy but the UI still looks empty, confirm you're looking at the correct site/org in the browser and that your dashboard's time range and tag filters aren't hiding the data.
Conclusion
A Datadog agent that isn't reporting is almost never a mystery — it's one of six things, and datadog-agent status tells you which. Work them in order: agent up and not crashlooping, valid API key, correct DD_SITE, outbound 443 connectivity, clock sync, then cardinality. The two that catch nearly everyone — an invalid key and a wrong site — look perfectly healthy from systemctl, which is exactly why you read the Forwarder instead. Restart after every config change, and if you're still dark, send a flare.
This is the troubleshooting companion to our observability cluster — Datadog Spark monitoring, Kafka lag monitoring, and Databricks monitoring — and if the Agent's cost, not its uptime, is your problem, weigh the best Datadog alternatives in 2026. Running observability in production and want a second set of eyes? Get matched with a vetted DevOps or data engineer on SolutionGigs — it's free to post a project.

Mohammed Yaseen
Founder, SolutionGigs
Mohammed runs Datadog across production data and infra workloads and has debugged the "connected but no metrics" problem more times than he'd like — it's usually the API key or the site. He teaches the free Learn Data Engineering course. LinkedIn →