
Datadog Log Management: The Complete Guide
Last Updated: July 2026 | 15 min read
Quick Answer: Datadog Log Management collects logs from the Agent and integrations, structures them through processing pipelines, makes a chosen subset searchable in indexes, and archives the rest to cheap cloud storage. Its defining trait is that ingestion and indexing are billed separately — you ingest everything cheaply (per GB) but only pay to index (per million events) the logs you actually query. Master that split, plus pipelines, exclusion filters, log-based metrics, and archives, and you get complete visibility without the runaway bill logs are infamous for.
Logs are the first thing engineers reach for in an incident and the first line item that blows up a monitoring budget. Datadog Log Management is powerful, but teams routinely index everything, watch the bill 5x, then rip logs out entirely — losing visibility to save money. It doesn't have to be that way. The whole platform is built around one idea: decouple ingesting a log from making it searchable. Once that clicks, you can afford to collect everything and still keep costs flat. This in-depth guide covers the full log lifecycle — collection, pipelines and processors, indexes and exclusion filters, the Log Explorer, log-based metrics, archives and rehydration, sensitive-data scrubbing, and a concrete cost-control playbook. If you haven't yet, start by installing the Datadog Agent.
What is Datadog Log Management?
Datadog Log Management is the log analytics product within Datadog that ingests, processes, searches, visualizes, and stores logs alongside your metrics and traces. It unifies logs with the rest of your observability so you can pivot from a metric spike to the exact log lines behind it.
Unlike a bare log store, Datadog treats logs as structured events: every log gets parsed into attributes (status, service, host, duration, custom fields) that you can search, facet, and aggregate — not just grep. And unlike most competitors, it separates the cost of collecting a log from the cost of keeping it searchable, which is the key to affordable log management at scale. Logs are the third pillar alongside metrics (dashboards) and monitors (alerting).
How the Datadog log pipeline works
Logs flow through a fixed lifecycle: collection → ingestion → pipelines → indexing (or exclusion → archive), then out to the Log Explorer, log-based metrics, and rehydration. Understanding each stage — and which ones cost money — is the whole game.
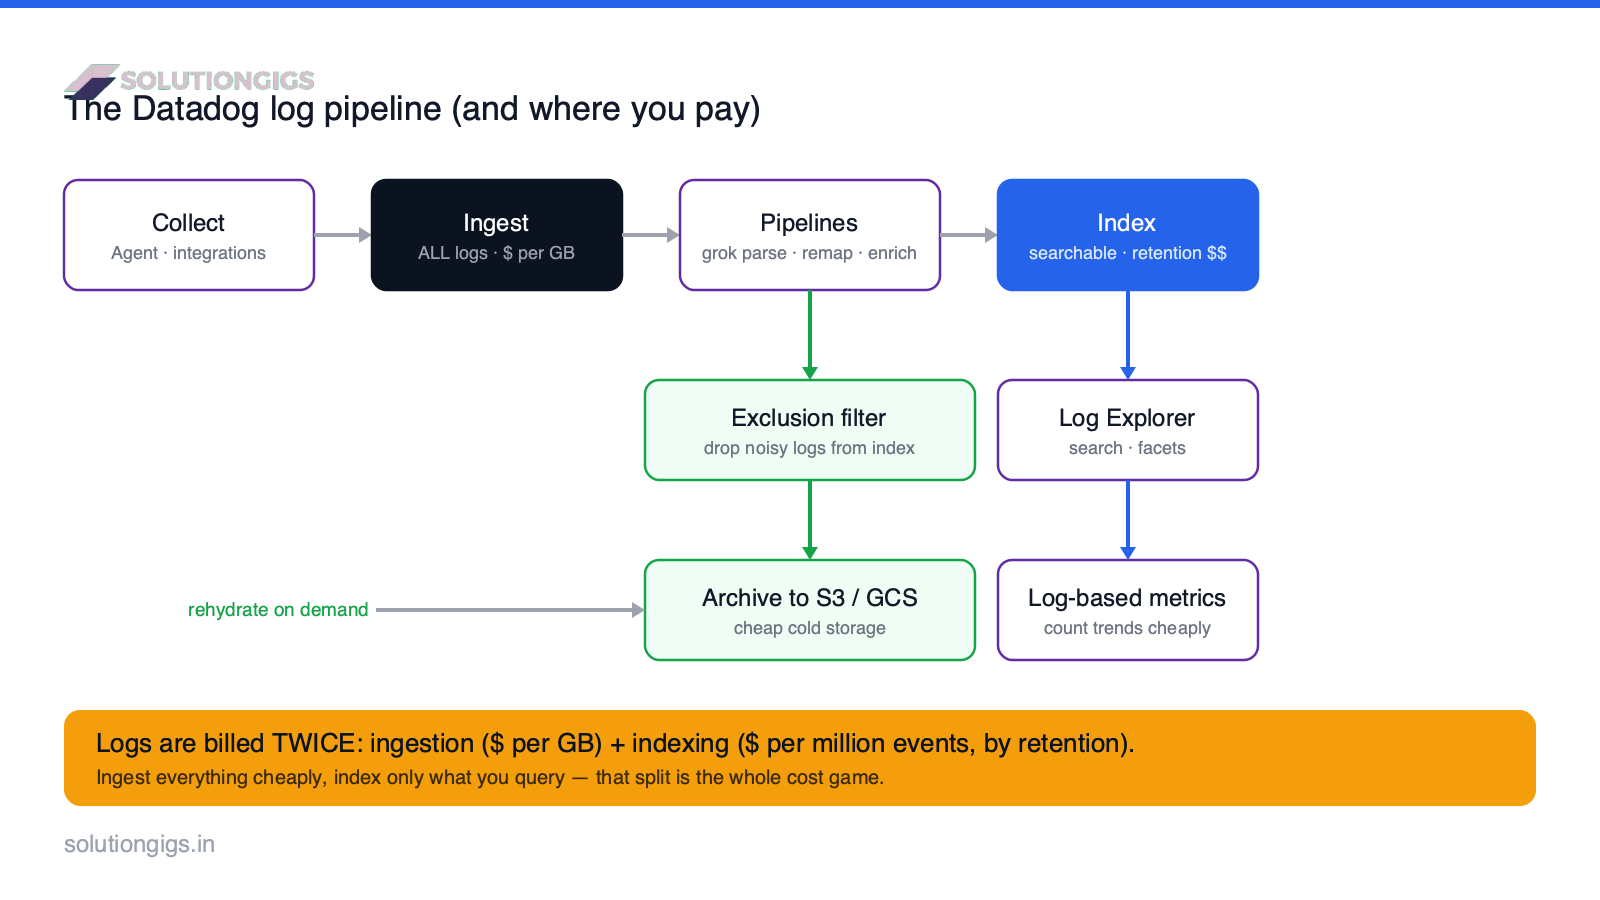
The stages:
- Collect — the Agent (or an integration/API) tails log files and forwards them.
- Ingest — logs enter Datadog; billed per GB. All ingested logs can feed pipelines, log-based metrics, and archives.
- Pipelines — processors parse and enrich each log into structured attributes.
- Index — logs you keep searchable are retained for a chosen period; billed per million events.
- Exclusion filter → Archive — logs you don't need searchable are dropped from the index but archived cheaply.
- Explorer / metrics / rehydration — you search indexed logs, trend them as metrics, or pull archives back on demand.
Step 1: Set up log collection
Enable log collection on the Agent, then tell it which logs to tail. At the Agent level, logs are off by default. Turn them on in datadog.yaml:
logs_enabled: true
Or via environment variable (Docker/Kubernetes): DD_LOGS_ENABLED=true. Then configure a source, for example tailing a file in conf.d/<integration>.d/conf.yaml:
logs:
  - type: file
    path: /var/log/myapp/*.log
    service: payments-api
    source: python
The source attribute is important: it tells Datadog which integration pipeline to apply (e.g. nginx, python, postgresql), so your logs get parsed automatically. In Kubernetes, the Agent auto-discovers container logs via annotations, and in Docker it reads the container stdout/stderr stream — no per-file config needed.
Step 2: Process logs with pipelines and processors
Pipelines turn raw log text into structured, searchable events using an ordered chain of processors. This is where an unreadable line becomes queryable fields.
Datadog ships integration pipelines for common sources (nginx, Postgres, etc.) that work out of the box. For custom logs, you build your own. The most-used processors:
| Processor | What it does |
|---|---|
| Grok parser | Extracts fields from unstructured text into attributes |
| Remapper | Maps a custom attribute onto a standard one (status, service, host) |
| Date remapper | Sets the official log timestamp |
| Status remapper | Maps a value to log severity (INFO/WARN/ERROR) |
| Category processor | Buckets logs by a rule (e.g. status code ranges) |
| Lookup / GeoIP | Enriches with reference data or geolocation |
| Sensitive Data Scanner | Redacts PII/secrets before indexing |
A grok parsing rule looks like this — turning "0.5s POST /checkout 200" into typed attributes:
myrule %{number:duration}s %{word:method} %{notSpace:url} %{number:status:integer}
Attribute remapping matters most. Mapping your app's fields onto Datadog's standard attributes (service, status, host, trace_id) is what unlocks correlation between logs, metrics, and APM traces. The official pipeline docs list every processor.
Step 3: Search and analyze in the Log Explorer
The Log Explorer is where you search, filter, and aggregate indexed logs using facets. A facet is an indexed attribute (like service or status) you can filter and group by; a measure is a numeric facet (like duration) you can aggregate.
Practical workflow:
- Search with a query like
service:payments-api status:error @duration:>1. - Facet to filter by env, service, or host from the sidebar.
- Aggregate into a timeseries or top-list to see, say, errors by endpoint.
- Pivot to traces — if
trace_idis remapped, jump straight from a log to the APM trace.
Step 4: Control what gets indexed (the cost lever)
Indexes and exclusion filters are the single most important cost control in Datadog logs. An index holds searchable logs for a retention period; an exclusion filter drops matching logs from that index while still archiving them.
This is the decoupling in action. You might ingest 2 TB of logs a month but only need 10% of them searchable. So you:
- Create exclusion filters for health checks, 200-OK access logs, and DEBUG lines — high volume, low investigative value.
- Set shorter retention (e.g. 3–7 days) for chatty services, longer only where you truly need history.
- Keep everything in archives regardless, so nothing is actually lost.
Rule of thumb: if you've never searched a log type during an incident, it probably shouldn't be indexed. Exclude it, archive it, and rehydrate if you ever need it.
Step 5: Generate log-based metrics
Log-based metrics let you trend and alert on log volume or values without indexing every event — cheaply. They're generated at ingestion, so they work even on logs you exclude from indexing.
For example, generate a count metric of error logs grouped by service, or a distribution of @duration from access logs. Now you can graph error rates and build monitors on them for a fraction of the cost of indexing the raw logs. This is a favorite pattern: exclude the noisy logs from the index, but keep a log-based metric so you still see the trend.
Step 6: Archive and rehydrate
Archives send all ingested logs to your own cheap cloud storage (S3, GCS, Azure Blob), and rehydration pulls them back into a searchable index on demand. This is how you keep months or years of logs for compliance without paying to index them.
- Archive — configure a bucket; Datadog writes compressed logs there continuously.
- Rehydrate — when an audit or deep investigation needs old logs, rehydrate a specific time range and query into a temporary index, pay only for what you pull, then let it expire.
Archives cost pennies compared to indexing, so the pattern is: short indexed retention for daily work + long archive retention for the "just in case."
Security: scrub sensitive data before it lands
The Sensitive Data Scanner redacts PII and secrets inside the pipeline, before logs are indexed or archived. Emails, credit-card numbers, API keys, and custom patterns are matched and masked at processing time, so raw sensitive values never become searchable. For regulated data (finance, health, PII), configure scanning rules early — retrofitting after sensitive data is already indexed is painful.
The Datadog logs cost model (in plain terms)
You pay for logs in two independent buckets — ingestion (per GB) and indexing (per million events, by retention) — and confusing the two is why bills explode. Here's the mental model:
| Action | Billed on | How to reduce |
|---|---|---|
| Send a log to Datadog | Ingestion — per GB | Sample verbose services; drop truly useless logs at source |
| Keep it searchable | Indexing — per million events × retention | Exclusion filters; shorter retention |
| Store it long-term | Archive — your cloud bucket (cheap) | Use lifecycle policies on the bucket |
| Trend/alert on volume | Log-based metric (cheap) | Prefer over indexing for high-volume logs |
The winning strategy is always the same: ingest broadly, index narrowly, archive everything. This mirrors the custom-metrics cardinality problem — in both cases, cost comes from keeping everything queryable when you only query a slice. Before a big rollout, estimate the blast radius with our free Datadog Cost Estimator; if logs dominate the bill, weigh Datadog alternatives.
Common mistakes to avoid
- Indexing everything by default. The #1 cause of surprise log bills. Exclude noise from day one.
- No archives. Without archives, excluding logs does lose data. Always archive, then exclude freely.
- Not remapping attributes. Unmapped
service/status/trace_idmeans no correlation and weak facets. - Long retention on chatty logs. 30-day retention on health-check logs is pure waste — use 3–7 days or exclude.
- Skipping the Sensitive Data Scanner. PII in an index is a compliance problem that's expensive to unwind.
- Ignoring "No Data"/missing logs. If logs stop, suspect the Agent — see agent not reporting.
Conclusion
Datadog Log Management is only expensive if you fight its design instead of using it. The platform deliberately separates ingesting a log from keeping it searchable — so the right pattern is to ingest broadly, run everything through pipelines that structure and scrub it, index only the slice you actually query, generate log-based metrics for the noisy rest, and archive it all cheaply with rehydration as your escape hatch. Teams that internalize the ingestion-vs-indexing split keep full visibility and a flat bill; teams that don't either overpay or blind themselves by turning logs off. Start by adding exclusion filters for your health-check and DEBUG logs this week — it's usually the single biggest, safest saving available.
Rolling out logging and want to size the bill before it surprises you? Use our free Datadog Cost Estimator, or get help from SolutionGigs → to design log pipelines that stay complete without going broke.

Mohammed Yaseen
Founder, SolutionGigs
Mohammed builds log pipelines and observability for Kafka/Spark/EMR data platforms and builds Telemetrix, an infrastructure-monitoring product — much of it spent keeping log bills flat without losing visibility. LinkedIn →