
Datadog Monitors & Alerting: The Complete Guide
Last Updated: July 2026 | 11 min read
Quick Answer: A Datadog monitor is a rule that evaluates a metric, log, or APM query against a condition and changes state — OK, Warn, Alert, or No Data — notifying people or tools when it does. Create one from Monitors → New Monitor, choose a type (metric, anomaly, log, composite…), set Warning and Alert thresholds with an evaluation window, and route notifications with @slack / @pagerduty handles. The hard part isn't creating alerts — it's making sure each one is worth waking someone up for.
Dashboards tell you something is wrong when you're looking. Datadog monitors tell you while you're asleep — and that's exactly why bad ones are so destructive. A monitor that pages on every harmless blip trains your team to ignore alerts, so the one that matters gets swiped away at 3 AM. This guide covers Datadog monitors and alerting end to end: the monitor types, how to create one, thresholds vs anomaly detection, composite monitors, notification routing, and — most importantly — how to alert on real problems without drowning in noise. First time here? Make sure you've installed the Datadog Agent and built a dashboard to alert from.
How Datadog monitors work
A Datadog monitor runs a query on a schedule, evaluates the result against your condition, transitions between states, and fires notifications on state change. That lifecycle is the whole game.
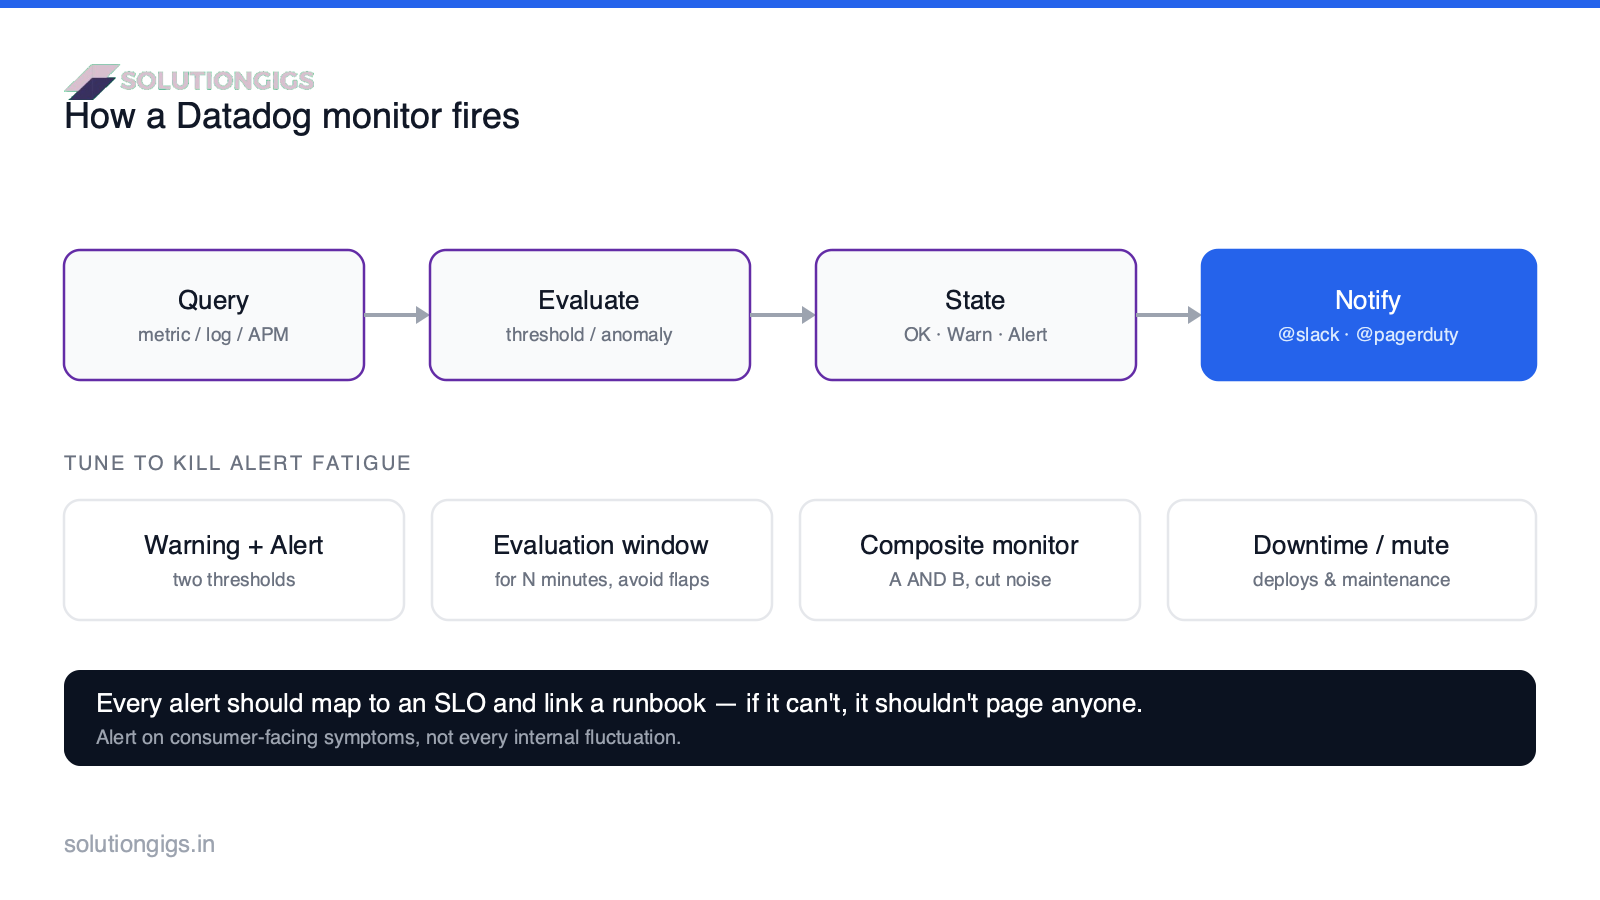
Every monitor moves through four possible states:
- OK — condition healthy.
- Warn — crossed the warning threshold (heads-up, usually no page).
- Alert — crossed the alert threshold (act now).
- No Data — the query returned nothing (often a broken Agent, not a healthy system — see agent not reporting).
Datadog monitor types (and when to use each)
Pick the monitor type that matches the shape of the problem, not just "metric monitor" for everything. The main types:
| Monitor type | Use it for |
|---|---|
| Metric (threshold) | Hard limits — disk > 90%, error rate > 1% |
| Anomaly | Seasonal metrics — traffic that varies by time of day |
| Forecast | Alert before a trend crosses a limit — disk filling up |
| Outlier | One host/pod behaving unlike its peers |
| Log | A spike in error logs or a specific pattern |
| APM | Service latency, error rate, throughput |
| Composite | Combine monitors with AND/OR to cut noise |
| Watchdog | Datadog's automatic anomaly detection |
How to create a Datadog monitor (step by step)
Creating a monitor is quick; the quality is in the thresholds and the message. The workflow:
- New monitor. Monitors → New Monitor, choose a type.
- Define the query. e.g.
avg(last_5m):avg:trace.http.request.duration{service:payments} > 0.5. - Set Warning and Alert thresholds. Two levels so warnings inform and alerts page.
- Add an evaluation window. "Condition true for the last 5 minutes" stops brief spikes from flapping.
- Write the message. Explain what's wrong, link a runbook, and route with
@handles. - Tag and save. Tag by team/service so alerts are searchable and ownable.
Thresholds vs anomaly detection
Use a fixed threshold for hard limits and anomaly detection for metrics whose "normal" changes over time. This choice prevents most false alarms.
A threshold like "alert if requests < 1000/min" fires every weekend when traffic is naturally lower — a classic false positive. An anomaly monitor learns the metric's daily and weekly seasonality and alerts only on genuine deviation from that pattern. Rule of thumb: static limits → threshold; behavior that varies by time → anomaly. This is the same seasonality problem we cover for data pipeline monitoring.
Composite monitors: the noise killer
A composite monitor fires only when multiple conditions are true at once, which dramatically cuts false pages. It references other monitors by ID and combines them with boolean logic.
The canonical example: don't page on high latency alone (could be a harmless blip) or high error rate alone — page only when latency is high AND error rate is high, because that combination almost always means a real user-facing incident. Composite monitors are one of the highest-leverage tools for a quiet, trustworthy on-call rotation.
Notification routing and alert messages
Route notifications in the monitor message with @ handles, and tailor the message per state so responders get context, not just a red flag. Datadog supports Slack, PagerDuty, Microsoft Teams, email, and webhooks.
Key techniques:
@routing —@pagerduty-paymentsfor alerts,@slack-oncallfor warnings.- Conditional messages —
{{#is_alert}}…{{/is_alert}}sends different text for Warn vs Alert. - Template variables —
{{host.name}},{{service.name}}inject the triggering context. - Runbook link — every alert message should link the fix. An alert with no next step just spreads panic.
How to kill alert fatigue
The goal isn't more alerts — it's fewer, higher-signal alerts that people trust. Alert fatigue is the number-one reason monitoring fails in practice. Apply these:
- Tie every alert to an SLO a consumer cares about. If it isn't, downgrade it to a dashboard. (The SLO/error-budget model comes from Google's SRE practice.)
- Use evaluation windows so momentary spikes don't flap.
- Prefer composite monitors to require corroborating signals.
- Schedule downtimes for deploys and maintenance so expected noise stays silent.
- Route by severity — page for Alert, Slack for Warning.
- Prune ruthlessly. A monitor nobody has acted on in 90 days is noise; delete it.
The one rule: every alert should map to an SLO and link a runbook. If it can't, it shouldn't page anyone.
Common mistakes to avoid
- Alerting on causes, not symptoms. Page on user-facing impact (latency, errors), not every CPU wiggle.
- No No-Data handling. A silent metric can mean a dead Agent; decide whether No Data should alert.
- Fixed thresholds on seasonal metrics. Use anomaly detection instead.
- Missing runbooks. An alert without a next step wastes the responder's time.
- Ignoring cost. Monitors are cheap, but the custom metrics they watch aren't — high cardinality inflates the bill. Size it with our Datadog Cost Estimator and see why bills explode.
Conclusion
Datadog monitors turn dashboards into a system that watches itself — but only good monitors are worth having. The mechanics are simple: pick the right type (threshold for hard limits, anomaly for seasonal metrics, composite to cut noise), set Warning and Alert levels with an evaluation window, and route notifications with a message that links a runbook. The discipline is harder and matters more: alert on consumer-facing symptoms tied to SLOs, schedule downtimes, and prune anything nobody acts on. Do that and your on-call rotation starts trusting its pager again — which is the entire point. Audit your noisiest monitor this week; odds are it should be a composite or a dashboard.
Setting up monitoring that catches real incidents without the 3 AM false alarms — or the surprise invoice? Size the cost with our free Datadog Cost Estimator, or get help from SolutionGigs →.

Mohammed Yaseen
Founder, SolutionGigs
Mohammed builds Datadog monitors and on-call alerting for Kafka/Spark/EMR data platforms and builds Telemetrix, an infrastructure-monitoring product focused on catching real incidents without the noise. LinkedIn →