
How to Install the Datadog Agent on Linux, Docker & Kubernetes
Last Updated: July 2026 | 10 min read
Quick Answer: To install the Datadog Agent, copy an API key from Organization Settings → API Keys, set your DD_SITE (e.g. datadoghq.com for US1), then run the one-line install script on Linux, the gcr.io/datadoghq/agent:7 container on Docker, or the datadog/datadog Helm chart on Kubernetes. Confirm it worked with datadog-agent status and check that the host appears on the Datadog Infrastructure list within a few minutes.
The Datadog Agent is the small piece of software that collects metrics, logs, and traces from your hosts and containers and ships them to Datadog. Getting it installed is usually a five-minute job — unless you set the wrong DD_SITE, in which case the Agent runs happily and sends data into the void. This guide covers how to install the Datadog Agent the right way on Linux, Docker, and Kubernetes, how to verify it's actually reporting, and the handful of mistakes that cause the dreaded "agent installed but no data" problem. Commands are copy-paste ready. New to the platform? Start with what Datadog is and how it's priced.
How the Datadog Agent works
The Datadog Agent is a lightweight collector that runs on your infrastructure, gathers telemetry locally, and forwards it over HTTPS to the Datadog platform. You install one Agent per host (or one pod per node on Kubernetes), point it at your account with an API key and site, and it handles the rest.
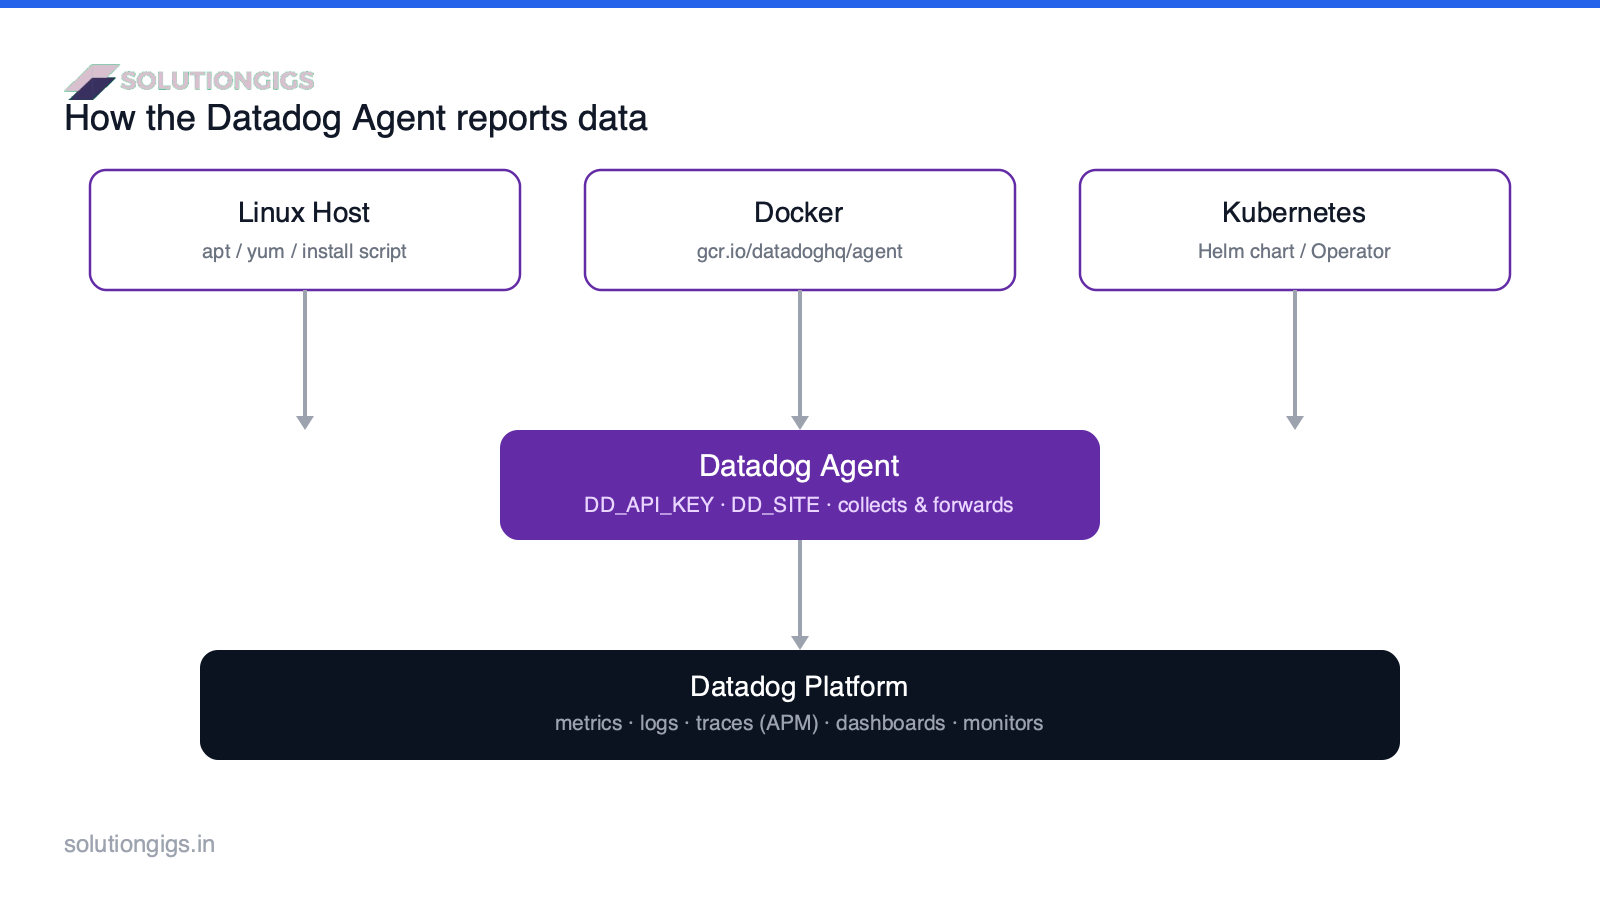
Two values drive every install method:
DD_API_KEY— authenticates the Agent to your organization.DD_SITE— the Datadog region your account lives in. This must match your account's site or nothing shows up.
Step 1: Get your API key and site
Before installing, grab an API key and confirm your Datadog site. In Datadog, go to Organization Settings → API Keys, create or copy a key, and keep it secret (treat it like a password).
Your site is visible in your Datadog URL. Common values:
| Region | DD_SITE |
|---|---|
| US1 | datadoghq.com |
| US3 | us3.datadoghq.com |
| US5 | us5.datadoghq.com |
| EU | datadoghq.eu |
| AP1 | ap1.datadoghq.com |
Step 2: Install the Datadog Agent on Linux
On Linux, the fastest path is the official one-line install script, which adds the Datadog repo, installs Agent v7, and starts the service. Set your key and site inline:
DD_API_KEY=<YOUR_API_KEY> DD_SITE="datadoghq.com" \
  bash -c "$(curl -L https://install.datadoghq.com/scripts/install_script_agent7.sh)"
Prefer your package manager? The Agent is also available via apt (Debian/Ubuntu) and yum/dnf (RHEL/Fedora) from the Datadog repositories. Config lives at /etc/datadog-agent/datadog.yaml; after editing it, restart with:
sudo systemctl restart datadog-agent
Step 3: Install the Datadog Agent on Docker
On Docker, run the official Agent image with your key, site, and the mounts it needs to see host and container metrics. One Agent container monitors every other container on that host:
docker run -d --name dd-agent \
  -e DD_API_KEY=<YOUR_API_KEY> \
  -e DD_SITE="datadoghq.com" \
  -e DD_LOGS_ENABLED=true \
  -v /var/run/docker.sock:/var/run/docker.sock:ro \
  -v /proc/:/host/proc/:ro \
  -v /sys/fs/cgroup/:/host/sys/fs/cgroup:ro \
  gcr.io/datadoghq/agent:7
The Docker socket mount lets the Agent auto-discover containers; the /proc and cgroup mounts let it read host-level metrics. Running rootless containers with Podman instead? The same image works — see Docker vs Podman for the socket differences.
Step 4: Install the Datadog Agent on Kubernetes
On Kubernetes, install the Agent as a DaemonSet via the official Helm chart so one Agent pod runs on every node. Add the repo and install:
helm repo add datadog https://helm.datadoghq.com
helm repo update

helm install datadog-agent datadog/datadog \
  --set datadog.apiKey=<YOUR_API_KEY> \
  --set datadog.site=datadoghq.com \
  --set datadog.logs.enabled=true \
  --set datadog.apm.portEnabled=true
For production, store the API key in a Kubernetes Secret rather than on the command line, and consider the Datadog Operator for lifecycle management. The chart also deploys a Cluster Agent, which collects cluster-level metrics and cuts load on the Kubernetes API server. This is the foundation for full Kubernetes monitoring — the natural next layer once nodes report.
Step 5: Verify the Agent is reporting
Confirm success with the Agent's own status command and the Infrastructure list — don't assume "no errors" means "reporting." On a host or in the container:
sudo datadog-agent status        # host install
kubectl logs <datadog-agent-pod> -c agent   # Kubernetes
Look for a successful Forwarder connection and green check runs. Then open Infrastructure → Host Map in Datadog; your host should appear within a few minutes. Need to share diagnostics with support? Run sudo datadog-agent flare.
Common installation problems (and fixes)
Ninety percent of "installed but no data" cases come down to three causes. Work through them in order:
- Wrong
DD_SITE. The Agent authenticates but sends to the wrong region. Match the site to your account URL exactly. - Invalid or revoked API key.
datadog-agent statusshows a403/auth error. Regenerate the key. - Blocked outbound HTTPS. The Agent needs egress on 443 to your Datadog site. Check firewalls and proxies.
For a systematic walkthrough of a silent Agent, see our dedicated guide: Datadog Agent not reporting — the ordered fix. The full option reference lives in the official Datadog Agent docs.
Keep an eye on cost from day one
The Agent is free, but what it sends is billed — and custom-metric cardinality is where bills surprise teams. A default host install is cheap; the cost creep starts when you emit custom metrics tagged with high-cardinality values. Before you enable lots of custom metrics or integrations fleet-wide, estimate the impact with our free Datadog Cost Estimator, and read why custom-metrics bills explode. If the projected cost is high, compare Datadog alternatives before committing.
Frequently Asked Questions
How do I install the Datadog Agent on Linux?
Run the official one-line script with your key and site: DD_API_KEY=<key> DD_SITE="datadoghq.com" bash -c "$(curl -L https://install.datadoghq.com/scripts/install_script_agent7.sh)". It adds the Datadog repo, installs Agent v7, writes the config with your key, and starts the service. Verify with sudo datadog-agent status.
What is DD_SITE in Datadog?
DD_SITE tells the Agent which Datadog region to send data to, and it must match your account's site or the Agent will authenticate but never appear. Common values are datadoghq.com (US1), us3/us5.datadoghq.com, datadoghq.eu (EU), and ap1.datadoghq.com. A wrong site is the most common cause of a silent Agent.
How do I run the Datadog Agent in Docker?
Run gcr.io/datadoghq/agent:7 with DD_API_KEY and DD_SITE set, and mount the Docker socket plus host /proc and cgroup paths so it can read container and host metrics. One Agent container per host monitors all other containers on that host through the Docker socket.
How do I install the Datadog Agent on Kubernetes?
Add the Helm repo (helm repo add datadog https://helm.datadoghq.com) and install the datadog/datadog chart with your API key and site, or use the Datadog Operator. The Agent runs as a DaemonSet — one pod per node — alongside a Cluster Agent that gathers cluster-level metrics and reduces API-server load.
How do I verify the Datadog Agent is working?
Run sudo datadog-agent status on a host or kubectl logs on the Agent pod and look for a successful forwarder connection and green checks. Then open the Infrastructure list in Datadog; the host should appear within minutes. If not, suspect a wrong DD_SITE, a bad API key, or blocked outbound HTTPS.
Is the Datadog Agent free?
The Agent is free and open source. You pay for what it sends: per host for infrastructure, plus custom metrics, logs, and APM. A basic install is inexpensive, but custom-metric cardinality can inflate costs quickly, so estimate before a wide rollout.
Conclusion
Installing the Datadog Agent is genuinely a few minutes of work: get an API key, set the right DD_SITE, run the one-liner for your platform — script on Linux, gcr.io/datadoghq/agent:7 on Docker, the Helm chart on Kubernetes — then verify with datadog-agent status and the Infrastructure list. The only real trap is the site mismatch that silently sends data nowhere, so check that first if a host doesn't show up. Once the Agent is reporting, you've laid the foundation for dashboards, monitors, and APM on top.
Rolling Datadog out across a fleet and want to size the bill first? Try our free Datadog Cost Estimator, or get help from SolutionGigs → to set up monitoring that's complete without being expensive.

Mohammed Yaseen
Founder, SolutionGigs
Mohammed runs Datadog Agents across Linux, Docker, and Kubernetes for Kafka/Spark/EMR data platforms and builds Telemetrix, an infrastructure-monitoring product. LinkedIn →