
Data Pipeline Monitoring: The Complete Guide to Metrics, SLAs & Alerting
Last Updated: July 2026 | 12 min read
Quick Answer: Data pipeline monitoring is the practice of continuously tracking the freshness, volume, quality, and system health of data as it flows through ingestion, transformation, storage, and serving. Good monitoring catches a pipeline that ran successfully but produced late or wrong data — the failure mode traditional job monitoring misses entirely. You do it by defining SLOs for four signal groups, instrumenting each stage, and alerting on consumer-facing symptoms tied to a runbook.
The worst data incidents are silent. The job is green, the DAG is all checkmarks, Airflow says "success" — and yet the revenue dashboard has been wrong for three days because an upstream API quietly started returning null for half the rows. Traditional monitoring asks "did the job run?" Data pipeline monitoring asks the harder question: "is the data right, complete, and on time?" This guide covers the metrics that matter, how to set data SLAs and SLOs, how to alert without drowning in noise, the tooling landscape, and how to keep monitoring cost from exploding. Everything here comes from running production pipelines on Kafka, Spark, and EMR — including the mistakes.
What is data pipeline monitoring?
Data pipeline monitoring continuously verifies that data moving through a pipeline is fresh, complete, correct, and flowing within its performance budget — and alerts a human when it isn't.
It differs from ordinary application or infrastructure monitoring in one decisive way. Application monitoring is system-centric: CPU, memory, request latency, error rate — "is the service up?" Pipeline monitoring adds a data-centric layer on top: "the job succeeded, but did it emit 2 million rows like every other Tuesday, or 40,000?" A pipeline can be perfectly healthy at the system level and still ship a data disaster. Both layers are required.
Three terms get used loosely; keep them distinct:
- Data monitoring — checking predefined conditions (freshness < 30 min, null rate < 1%) and alerting on breaches.
- Data observability — the broader capability to understand why something broke, using lineage, metadata, and historical context.
- Data quality testing — assertions run at specific gates (see our guide to testing your data pipelines). Monitoring is continuous; testing is a checkpoint.
How data pipeline monitoring works
Monitoring instruments every stage of the pipeline, ships metrics and logs to a central store, evaluates them against SLOs, and routes breaches to on-call. The diagram below shows the full loop.
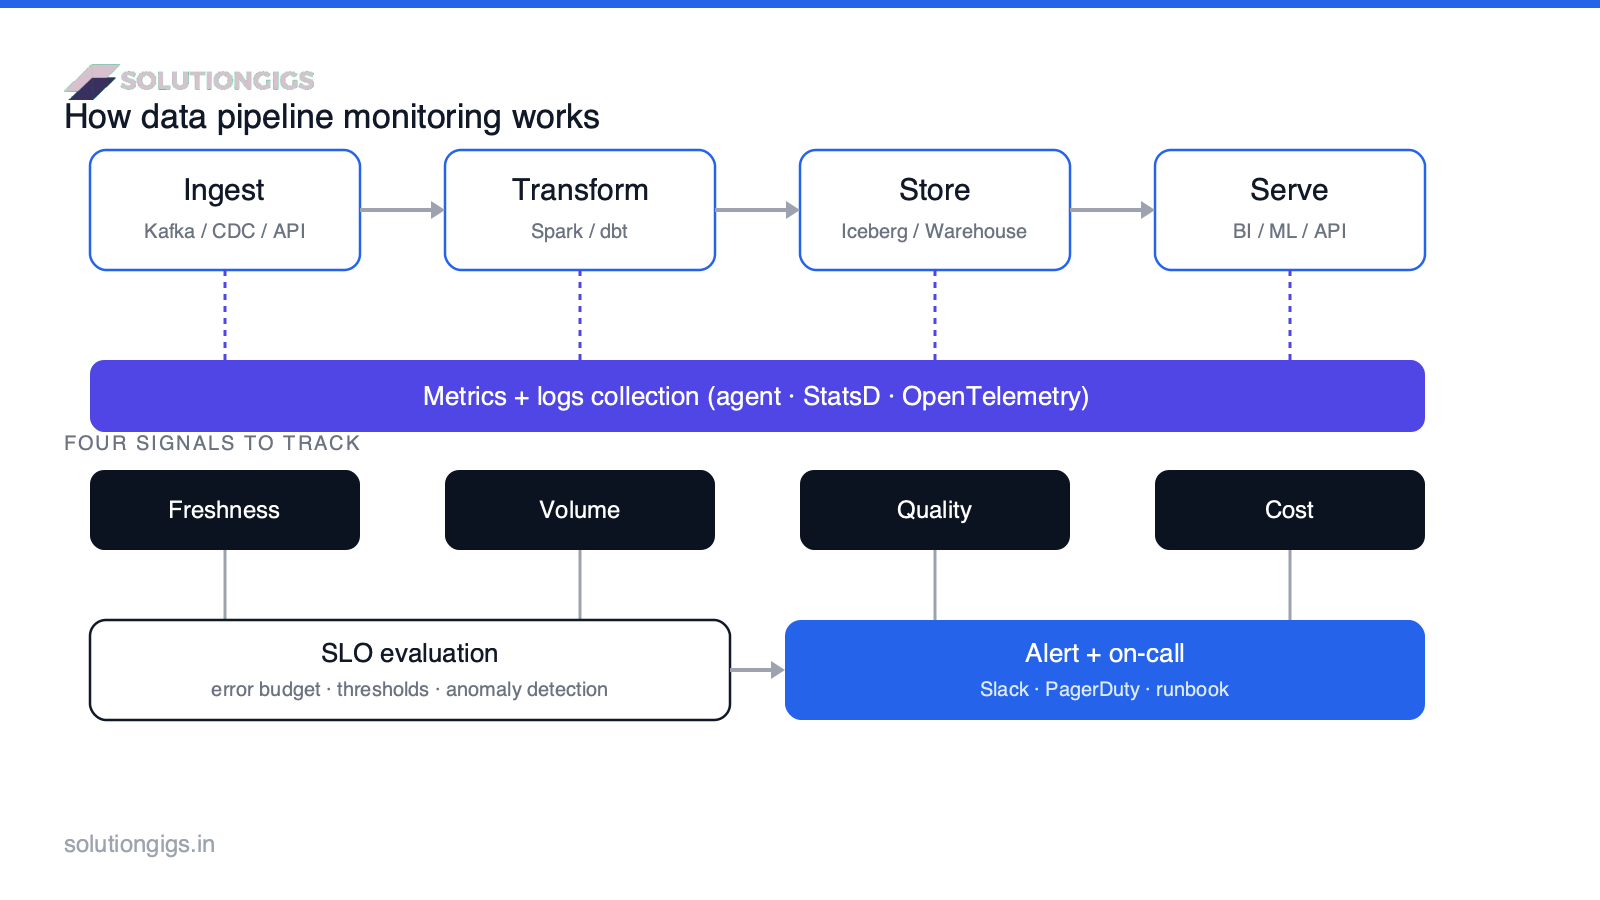
The flow has four parts:
- Instrumentation at each stage. Ingestion (Kafka, CDC, APIs), transformation (Spark, dbt), storage (Iceberg, a warehouse), and serving (BI, ML, APIs) each emit metrics — via an agent, StatsD, or OpenTelemetry, the vendor-neutral instrumentation standard.
- Collection. Metrics and logs land in a backend (Datadog, Prometheus, Grafana Cloud, or a warehouse-native tool).
- SLO evaluation. Raw signals are compared against targets — fixed thresholds, error budgets, or anomaly detection for seasonal data.
- Alerting. Breaches route to Slack or PagerDuty with a linked runbook, so the on-call engineer knows what to do, not just that something is red.
What metrics should you monitor? The four signals
Track four signal groups. If you only have time for two, do freshness and volume — together they catch the majority of real incidents.
1. Freshness (timeliness)
Freshness measures how late your data is versus when consumers expect it. It's the single most valuable data metric because staleness is the most common — and most visible — failure. Track the timestamp of the newest record versus now, and the gap between pipeline runs.
- SLI: minutes since the last successful partition/commit.
- Example alert: "orders table has not updated in 45 minutes (SLO: 30)."
2. Volume (completeness)
Volume tracks row counts and byte throughput against an expected range. A sudden drop signals a broken upstream source; a spike signals duplicates or a backfill gone wrong. Use a rolling baseline, not a fixed number, because volume is seasonal.
- SLI: rows written per run versus the trailing 7-day band.
- Example alert: "daily events row count is 60% below the 7-day median."
3. Quality (correctness)
Quality catches the silent corruption that freshness and volume miss — the job ran on time, with the right row count, but the values are wrong. Monitor null rates on critical columns, duplicate keys, schema drift, and referential integrity. This is where continuous monitoring meets data quality testing and idempotent pipeline design.
- SLI: null percentage on
customer_id, count of duplicate primary keys. - Example alert: "null rate on
emailjumped from 0.2% to 18%."
4. System health & cost
System health covers the operational metrics that predict data problems before they surface — job duration, retry counts, and streaming lag. For streaming, Kafka consumer lag is the leading indicator that your pipeline is falling behind real time. Cost belongs here too: monitoring bills can quietly rival compute bills.
| Signal | Key metric | Catches |
|---|---|---|
| Freshness | Minutes since last update | Late / stalled data |
| Volume | Rows vs rolling baseline | Missing or duplicated data |
| Quality | Null %, dupes, schema drift | Silent corruption |
| System / cost | Job duration, lag, spend | Degradation & runaway bills |
Data SLAs, SLOs, and SLIs (without the confusion)
An SLI is what you measure, an SLO is your internal target, and an SLA is the promise you make to consumers. Borrowed from Google's Site Reliability Engineering practice, this framing keeps alerting sane.
- SLI — data freshness = 12 minutes (a measured fact).
- SLO — "95% of days, freshness ≤ 30 minutes" (your internal goal; you alert on this).
- SLA — "data is available by 9 AM" (the external, looser commitment to the business).
Keep the SLA looser than the SLO so the gap is your error budget — the amount of unreliability you can spend before you must stop shipping features and fix reliability. Alert on the SLO breach, not the SLA breach, so you have time to react before you break a promise. Google's SRE book is the canonical reference for error budgets.
Rule of thumb: if an alert isn't tied to an SLO a consumer cares about, it shouldn't page anyone. Downgrade it to a dashboard.
Monitoring tools for data pipelines
There's no single winner — the right stack depends on whether you're metrics-first or warehouse-first. The main categories:
- General observability platforms — Datadog, New Relic, Grafana + Prometheus. Best when you already run infrastructure monitoring and want pipeline metrics beside it. See our deep dives on Datadog Spark monitoring, Datadog Kafka lag monitoring, and Datadog Databricks monitoring.
- Data observability tools — Monte Carlo, Bigeye, and similar, which specialize in freshness/volume/quality anomaly detection with lineage, using the "five pillars of data observability" framing popularized by Monte Carlo.
- Warehouse-native testing — dbt tests and Great Expectations, which assert quality at transform time (see dbt vs Airflow).
- Open standards — OpenTelemetry for vendor-neutral instrumentation so you're not locked to one backend.
At SolutionGigs, we built Telemetrix precisely because stitching these layers together for Kafka/Spark/EMR stacks is painful — teams end up with system metrics in one tool and data quality in another, and no single pane that answers "is the pipeline healthy and is the data right?"
Common mistakes that make monitoring useless
Even well-instrumented teams undermine themselves. The recurring failures:
- Monitoring jobs, not data. A green DAG with wrong output is the classic silent incident. Add data-level checks, not just task success.
- Fixed thresholds on seasonal metrics. "Alert if rows < 1M" fires every weekend when traffic is naturally lower. Use rolling baselines or anomaly detection.
- Alert fatigue. If everything pages, nothing pages. Tie alerts to SLOs, group them, and route by severity.
- No runbook. An alert that says "freshness breach" with no next step just moves panic around. Every alert links to a fix.
- Ignoring monitoring cost until the invoice. This is the big one, and it deserves its own section.
Keeping monitoring cost under control
The number-one driver of surprise monitoring bills is high-cardinality custom metrics, not dashboard count. Most platforms — Datadog especially — bill one custom metric per unique combination of metric name and tag values. Tag a metric with an unbounded dimension like user_id, request_id, or container_id and a single metric silently becomes hundreds of thousands of billable time series. We break the mechanic down fully in why your Datadog custom-metrics bill exploded, and if the bill is already too high, these Datadog alternatives can cut it.
To keep spend proportional to value:
- Never tag metrics with unbounded values — those belong in logs and traces.
- Aggregate to the dimensions you actually alert on (
service,env,dataset). - Sample logs and use tiered retention.
- Estimate before you ship. Plug your metrics, tags, and cardinality into our free Datadog Cost Estimator → to see your projected bill and the exact tag driving it before it hits the invoice.
How to start monitoring an existing pipeline (5 steps)
- Map consumers and their expectations. Who reads each table, and by when? That defines your SLAs.
- Set SLOs for freshness and volume first. These two catch most incidents with the least effort.
- Instrument each stage with an agent or OpenTelemetry, shipping to one backend.
- Add quality checks at transform gates — null rates, dupes, schema — using dbt tests or Great Expectations.
- Wire alerts to runbooks and route by severity. Review and prune alerts monthly.
Frequently Asked Questions
What is data pipeline monitoring?
Data pipeline monitoring continuously tracks the freshness, volume, quality, and system health of data as it moves through ingestion, transformation, storage, and serving, and alerts when any signal breaches its target. Crucially, it catches pipelines that ran successfully but produced late or wrong data — the failure mode plain job monitoring misses.
What metrics should you monitor in a data pipeline?
Monitor four groups: freshness (how late data is versus its SLA), volume (row counts and throughput versus an expected range), quality (null rates, duplicates, schema drift), and system health and cost (job duration, retries, consumer lag, spend). Freshness and volume alone catch most real incidents; quality catches the silent-corruption cases.
What is a data SLA, SLO, and SLI?
An SLI is a measured number such as freshness in minutes. An SLO is your internal target for it, e.g. "95% of days, fresh within 30 minutes." An SLA is the looser external promise you make to consumers. Alert on the SLO so you have buffer before the SLA — the gap between them is your error budget.
What is the difference between data monitoring and data observability?
Monitoring tells you that something is wrong against checks you defined in advance. Observability helps you understand why, using lineage, metadata, and the ability to ask new questions after an incident. Monitoring is a subset of observability — you need known checks and alerts first, then context to debug faster.
How do you reduce the cost of monitoring data pipelines?
Cost usually explodes from high-cardinality custom metrics, not dashboards. Avoid tagging metrics with unbounded values like user_id, aggregate to the dimensions you alert on, sample logs, and use tiered retention. On Datadog, estimate custom-metric cardinality with a cost calculator before shipping.
How do you avoid alert fatigue in data pipelines?
Alert only on consumer-facing symptoms (stale or wrong data), tie every alert to an SLO and a runbook, use dynamic thresholds for seasonal metrics, group related alerts, and route by severity. Delete any alert nobody has acted on in 90 days — an ignored alert is worse than no alert.
Conclusion
Data pipeline monitoring is what separates teams that discover a broken pipeline from a stakeholder's angry Slack message from teams that catch it first, quietly, and fix it before anyone notices. The playbook is consistent: measure the four signals — freshness, volume, quality, and system health — set SLOs against consumer expectations, alert on symptoms tied to runbooks, and watch monitoring cost as carefully as compute. Start with freshness and volume on your most important table this week; you'll catch more incidents than any dashboard ever will.
If your Datadog bill is dominated by custom metrics and you're not sure which pipeline is responsible, start with our free Datadog Cost Estimator to find the cardinality driving it — then read how to cut that bill. Building or fixing a monitoring stack for Kafka, Spark, or EMR? SolutionGigs can help →

Mohammed Yaseen
Founder, SolutionGigs
Mohammed builds Telemetrix, an infrastructure-monitoring platform for Kafka, Spark, and EMR pipelines, and has spent years wiring up production data-pipeline monitoring and taming observability bills. LinkedIn →