
Datadog Synthetic Monitoring: The Complete Guide
Last Updated: July 2026 | 16 min read
Quick Answer: Datadog Synthetic Monitoring proactively tests your apps and APIs with scripted robots that run on a schedule from locations you choose — so you catch outages, broken checkout flows, SSL expiry, and slowdowns before real users do. There are two test types: API tests (fast HTTP/DNS/SSL/TCP/gRPC requests with assertions) and browser tests (a real Chrome/Firefox/Edge driven through a recorded user journey). You define assertions ("status is 200", "body contains order_id", "response time < 800ms"), pick managed or private locations, set alert conditions, and can even run tests in CI/CD to block a bad deploy. It's the proactive half of digital experience monitoring — the complement to RUM, which watches real users.
Most teams find out their checkout is broken the same way: an angry customer, a support ticket, a revenue dip on a Monday-morning dashboard. By then it's been broken for hours. Datadog Synthetic Monitoring flips that around — a robot logs in, adds to cart, and checks out every minute from five continents, and pages you the moment any step fails or slows down. This is the difference between reactive and proactive monitoring. In this deep guide you'll get the full picture with real config examples: API vs browser tests, the assertion engine, multistep flows that log in and chain tokens, managed vs private locations, alerting that doesn't cry wolf, CI/CD gates with datadog-ci, trace linking into APM, and the per-run cost model. If you're just getting started with Datadog, first install the Agent — though note that synthetics run from Datadog's infrastructure, not your Agent.
What is Datadog Synthetic Monitoring?
Datadog Synthetic Monitoring is proactive, outside-in testing: scripted checks that continuously exercise your endpoints and user journeys from real locations and alert you when something breaks. "Synthetic" because the traffic is simulated by robots, not real users.
Think of it as an always-on QA team that never sleeps. Every test has three parts: a request or journey (hit this URL, or click through these steps), a set of assertions (what "healthy" means), and a schedule + locations (run every 5 minutes from Mumbai, Frankfurt, and N. Virginia). When assertions fail on enough locations, Datadog opens an alert and — for browser tests — captures screenshots and a full step-by-step timeline so you can see exactly where it broke.
Synthetics sit in Datadog's Digital Experience Monitoring family alongside RUM. The mental split that ties the whole observability stack together:
Synthetics tell you the site is up. RUM tells you the site is good. APM tells you why it isn't. Logs tell you what happened.
Synthetic Monitoring vs RUM: when to use which
Use synthetics for proactive uptime and critical-flow validation; use RUM to measure the real experience of actual users. They overlap in spirit but answer different questions, and you almost always want both.
| Synthetic Monitoring | RUM | |
|---|---|---|
| Traffic source | Scripted robots | Real users |
| When it runs | On a schedule, always | Only when users visit |
| Coverage | Any page/flow, even zero-traffic | Only trafficked pages |
| Best at | Uptime, SLAs, catching outages early, pre-prod | True experience, Core Web Vitals, real errors |
| Consistency | High — same script, same locations | Variable — real devices/networks |
| Catches issues | Before users | As users hit them |
The rule of thumb: synthetics are your smoke alarm, RUM is your thermometer. A synthetic test on /checkout warns you the flow is down at 3 AM with no traffic; RUM tells you that real users in a certain region get a slow LCP. You need the alarm and the thermometer.
The two test types: API tests and browser tests
Datadog offers API tests (protocol-level requests) and browser tests (a real browser driven through steps), plus multistep versions of each. Choosing the right type per check is what keeps synthetics fast and affordable.
| Test type | What it does | Speed / cost | Use for |
|---|---|---|---|
| API — HTTP | Single HTTP request + assertions | Fast / cheap | Uptime, health checks, API contracts |
| API — SSL | Checks certificate validity & expiry | Fast / cheap | Cert expiry alerts |
| API — DNS | Resolves a record, asserts on it | Fast / cheap | DNS correctness |
| API — TCP / UDP / gRPC / WebSocket | Connection/protocol checks | Fast / cheap | Non-HTTP services, ports |
| API — Multistep | Chains several API requests, passes variables | Medium | Auth + workflow validation |
| Browser | Drives Chrome/Firefox/Edge through recorded steps | Slow / pricey | Full user journeys, front-end |
Default to API tests; reserve browser tests for the handful of journeys that actually earn the cost (login, checkout, signup). A common pattern: dozens of cheap API tests for coverage, plus 3–5 browser tests on your revenue-critical flows.
How Datadog Synthetic Monitoring works
A test definition (request + assertions + schedule) runs from managed or private locations; results feed the dashboard, alerts, and — via trace linking — APM. Understanding the moving parts explains both the setup and the bill.
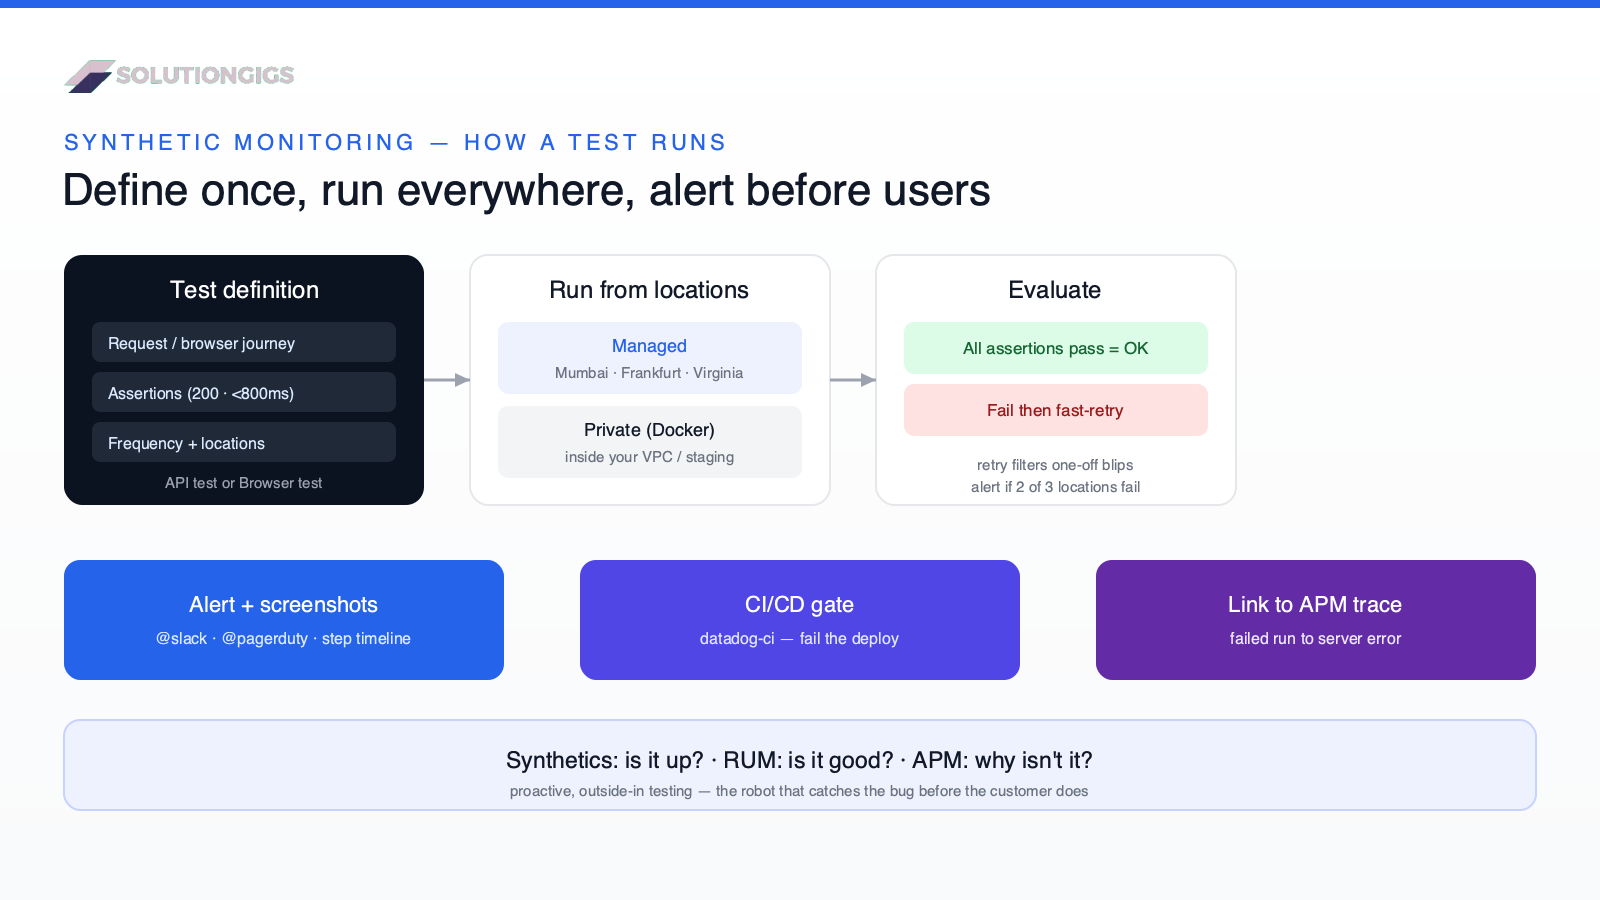
The flow:
- Define the test — request/journey, assertions, frequency, and locations.
- Execute from locations — Datadog managed locations (public internet, worldwide) or your private locations (Docker workers inside your network).
- Evaluate assertions — every assertion must pass or the test fails.
- Retry logic — a failed test can fast-retry to filter out one-off blips before alerting.
- Alert + capture — on failure, notify via
@slack/@pagerdutyand (browser) capture screenshots and step timings. - Correlate — link the failing run to the backend APM trace so you can jump from "checkout failed" to the exact server error.
API tests in depth (with examples)
An API test sends a request and passes only if every assertion holds. Here's a real HTTP test configuration for a health endpoint:
Test type:  HTTP
Method:     GET
URL:        https://api.web-store.com/health
Frequency:  every 1 minute
Locations:  aws:ap-south-1 (Mumbai), aws:eu-central-1 (Frankfurt), aws:us-east-1

Assertions:
  - status code       is           200
  - response time     less than    800  (ms)
  - header "content-type"  contains  application/json
  - body (jsonpath $.status)  is    "ok"
If the endpoint returns a 500, takes 1,200 ms, or the body's status isn't "ok", the test fails. Simple, but this one check catches the majority of "the API is down" incidents.
Multistep API tests: login, then act
Real APIs need auth. A multistep API test chains requests and passes extracted values between them — for example, log in, capture the token, then call a protected endpoint with it:
Step 1 — POST /auth/login
  body: {"email": "{{ SYNTHETIC_USER }}", "password": "{{ SYNTHETIC_PASS }}"}
  assert: status is 200
  extract: TOKEN  ←  response body jsonpath $.access_token

Step 2 — GET /orders/recent
  header: Authorization: Bearer {{ TOKEN }}
  assert: status is 200
  assert: body jsonpath $.orders  length greater than 0
  extract: ORDER_ID  ←  $.orders[0].id

Step 3 — GET /orders/{{ ORDER_ID }}
  assert: status is 200
  assert: response time less than 500
{{ SYNTHETIC_USER }} and {{ SYNTHETIC_PASS }} are global variables (store secrets encrypted at the org level, never inline). TOKEN and ORDER_ID are local variables extracted at runtime. This one test proves auth, data access, and a detail lookup all work end to end.
Specialized API tests
- SSL test — assert the certificate for
web-store.comdoesn't expire within, say, 30 days. This alone prevents the classic "cert expired over the weekend" outage. - DNS test — assert
web-store.comresolves to the expected A record. - TCP/gRPC/WebSocket — for services that don't speak HTTP.
Browser tests in depth (with an example)
A browser test drives a real browser through a recorded journey and asserts on what the user actually sees — the closest thing to a robot using your product. You record steps with the Datadog browser extension, then Datadog replays them on a schedule.
A checkout browser test looks like this:
Starting URL: https://web-store.com
Device:       Laptop (also test Mobile viewport)
Browser:      Chrome, Firefox

Steps:
  1. Click  "Sign in"
  2. Type   {{ SYNTHETIC_USER }}  into  #email
  3. Type   {{ SYNTHETIC_PASS }}  into  #password
  4. Click  "Log in"
  5. Assert  element  ".dashboard"  is present
  6. Navigate to  /product/DD-42
  7. Click  "Add to cart"
  8. Assert  text  "1 item"  is present in  ".cart-badge"
  9. Click  "Checkout"
 10. Assert  text  "Order confirmed"  is present
 11. Assert  page load time  less than  4s
If step 7 stops working because a deploy changed the button, the test fails at that step with a screenshot and the exact error — no guessing. Browser tests support the same variables, plus advanced steps (assertions on cookies, uploads, iframes, and custom JavaScript).
Assertions: the heart of every test
An assertion is a condition that must be true for the test to pass — they define what "working" means. Weak assertions ("status is 200") pass even when the page is broken; strong assertions catch real regressions.
| Assertion target | Example |
|---|---|
| Status code | is 200 / is not 500 |
| Response time | less than 800ms |
| Response body | contains "order_id" |
| JSONPath | $.data.status is "active" |
| XPath / element | element .confirmation is present |
| Header | content-type contains application/json |
| Certificate | expires in more than 30 days |
| Page text (browser) | "Order confirmed" is present |
Best practice: assert on business meaning, not just HTTP. A 200 with an empty cart page is still a broken checkout. Assert that the confirmation text, the order ID, or the expected element is actually there.
Managed vs private locations
Managed locations test from the public internet worldwide; private locations test internal apps from inside your network. Pick per test based on what you're validating.
- Managed locations — Datadog-hosted points in AWS regions across every continent. Use for public sites, global latency comparisons, and real outside-in uptime. Testing
/checkoutfrom Mumbai and São Paulo tells you if a CDN edge is misbehaving in one region. - Private locations — a lightweight Docker container you run inside your VPC or data center:
docker run --rm -d \
  -e DATADOG_API_KEY=<API_KEY> \
  -e DATADOG_ACCESS_KEY=<ACCESS_KEY> \
  -e DATADOG_SECRET_ACCESS_KEY=<SECRET> \
  -e DATADOG_PRIVATE_LOCATION_CONFIG="$(cat worker-config.json)" \
  gcr.io/datadoghq/synthetics-private-location-worker
Use private locations for staging, internal dashboards, and pre-production apps that aren't exposed to the internet — the same test definitions, just executed from behind your firewall.
Alerting without false pages
Configure fast retries, an alert condition based on how many locations fail, and a clear notification message — so a single blip doesn't page anyone. Flaky synthetic alerts are as destructive as flaky metric monitors.
Key controls:
- Retries — "retry once, 300ms later" filters transient network noise. Only a test that fails and fails the retry counts.
- Alert condition — page only if the test fails from ≥ 2 of 3 locations for 2 consecutive checks. One location failing is often that location, not you.
- Renotify & escalation — re-alert if still failing after N minutes; route to
@pagerduty-oncallfor revenue flows,@slack-engfor the rest. - Fast vs slow tests — a test can alert on failure or on slow response, which lets you catch degradation before a hard outage.
Every synthetic alert should tie to an SLO and a runbook, exactly like any other monitor — see the monitors & alerting guide.
Synthetics in CI/CD: shift-left testing
Run synthetic tests inside your pipeline with the datadog-ci CLI and fail the build if a critical flow breaks — catching regressions before they ship. This turns monitoring into a release gate.
Trigger tests by public ID or tags from any CI system:
# install once
npm install -g @datadog/datadog-ci

# run all tests tagged env:ci and fail the pipeline on any failure
datadog-ci synthetics run-tests \
  --apiKey "$DD_API_KEY" \
  --appKey "$DD_APP_KEY" \
  --search 'tag:env:ci'
In GitHub Actions:
- name: Run Datadog Synthetic tests
  run: datadog-ci synthetics run-tests --search 'tag:critical-flow'
  env:
    DD_API_KEY: ${{ secrets.DD_API_KEY }}
    DD_APP_KEY: ${{ secrets.DD_APP_KEY }}
Point the tests at your freshly deployed preview environment (override the startUrl), and a broken login flow now fails the PR instead of production. This is the single highest-leverage synthetics practice most teams haven't adopted.
Connecting Synthetics to APM
When a browser or HTTP test hits an instrumented backend, Datadog links the synthetic run to the resulting APM trace — so a failed test opens directly onto the server-side error. Enable it and you skip the "now reproduce it" step entirely.
The failing /checkout run isn't just a red X — it carries the trace_id, so you click straight into the APM flame graph, see the 500 came from a database timeout in the payments service, and jump to the log lines for that request. Synthetic → trace → log, in three clicks.
The cost model
API tests are billed per 10,000 runs and browser tests per 1,000 runs, so cost = number of tests × frequency × locations — with browser tests being the expensive lever. A little math prevents a big surprise.
| Choice | Cost impact |
|---|---|
| Test frequency | every 1 min = 60× an hourly test |
| Number of locations | 5 locations = 5× the runs |
| Browser vs API | browser tests cost far more per run |
| Number of tests | linear |
The playbook mirrors the rest of the Datadog cost story: be deliberate about what runs how often. Health-check API tests every minute from a few locations are cheap; a browser test every minute from ten locations is not. Reserve high-frequency, multi-location browser tests for the flows that make money. Size it up front with our free Datadog Cost Estimator; if digital-experience monitoring dominates, weigh Datadog alternatives.
Best practices and common mistakes
- Assert on business meaning, not just
200. A 200 with a broken page still "passes" a weak test. Assert the confirmation text or order ID exists. - Use retries and multi-location alert conditions. Alerting on a single failed run from one location is how you train the team to ignore synthetics.
- Don't put browser tests on everything. They're the expensive kind — reserve them for critical journeys, cover the rest with API tests.
- Store credentials as encrypted global variables. Never inline passwords or tokens in a test.
- Test from where your users are. If half your traffic is in India, test from
ap-south-1, not just US regions. - Gate deploys in CI. A synthetic that only runs in prod catches breakage after release; run it in the pipeline too.
- Enable APM trace linking. Without it, a failed test tells you that it broke but not why — you lose the fastest path to root cause.
- Watch SSL expiry with an SSL test. The cheapest test that prevents one of the most embarrassing outages.
How SolutionGigs can help
At SolutionGigs we set up synthetic monitoring on the products we build — including Telemetrix, our infrastructure-monitoring platform — and the pattern that pays off is always the same: a handful of browser tests on the revenue flows, a broad layer of cheap API tests for coverage, all wired to APM trace linking and gated in CI so broken journeys never reach production. If you want proactive monitoring that pages you before your customers do, see how SolutionGigs can help →.
Frequently Asked Questions
What is Datadog Synthetic Monitoring used for?
Datadog Synthetic Monitoring is used to proactively test uptime, API contracts, and critical user journeys with scripted robots that run on a schedule from chosen locations. It catches outages, broken checkout or login flows, SSL certificate expiry, DNS problems, and latency regressions before real users experience them, and can gate deployments in CI/CD to stop regressions from shipping.
Do synthetic tests need the Datadog Agent?
No. Synthetic tests run from Datadog's managed locations or from private-location Docker workers, not from the Datadog Agent on your hosts. You only need the Agent for infrastructure metrics, logs, and APM. That said, enabling APM on your backend lets Datadog link a synthetic test run to the trace it generated, which is well worth doing.
How often should synthetic tests run?
Match frequency to how critical and how expensive the test is. Run cheap API health checks on critical endpoints every 1–5 minutes from a few locations; run browser tests on revenue flows every 5–15 minutes from your key regions. Non-critical checks can run every 30–60 minutes. Since cost scales with frequency and locations, reserve high frequency for what truly matters.
Can Datadog synthetic tests handle logins and authentication?
Yes. Multistep API tests can POST credentials, extract the returned token, and reuse it in later steps via variables, while browser tests record the actual login journey. Store credentials as encrypted global variables at the org level so they're never exposed in the test definition, and reuse them securely across every step.
What is the difference between managed and private locations?
Managed locations are Datadog-hosted testing points on the public internet across global AWS regions, used to test public-facing apps and measure real-world latency. Private locations are Docker workers you run inside your own network to test internal or pre-production apps that the public internet can't reach. Both run the same test definitions; only the execution point differs.
Is Datadog Synthetic Monitoring better than open-source alternatives?
Datadog Synthetics is stronger when you want tests correlated with the rest of your observability — trace linking to APM, one alerting pipeline, and RUM alongside — without maintaining infrastructure. Open-source tools like Playwright or a self-hosted checker can be cheaper and more flexible but require you to build scheduling, alerting, global locations, and dashboards yourself. Choose based on whether integration or independence matters more.
Conclusion
Datadog Synthetic Monitoring is how you find out your checkout is broken from a robot at 3 AM instead of an angry customer at 9 AM. It's proactive, outside-in testing: API tests for fast, broad coverage of uptime and API contracts; browser tests for the handful of user journeys that make or break revenue; strong assertions that check business meaning, not just a 200; managed and private locations so you test both public and internal apps; and CI/CD gates that stop regressions before they ship. Wire it to APM trace linking and pair it with RUM and you have the complete digital-experience picture — the robot that proves it works, the real-user data that proves it's fast, and the traces that explain any failure. Start with three things this week: an SSL test on your main domain, an HTTP test on your health endpoint, and one browser test on your most important flow. That's most of the value for almost none of the effort.
Rolling out synthetic monitoring and want to size the bill before it surprises you? Use our free Datadog Cost Estimator, or get help from SolutionGigs → to design synthetic tests that page you — not your customers.

Mohammed Yaseen
Founder, SolutionGigs
Mohammed sets up proactive synthetic monitoring and CI/CD test gates for data platforms and builds Telemetrix, an infrastructure-monitoring product — much of it spent making sure broken flows page an engineer before they ever reach a customer. LinkedIn →