
Datadog APM & Distributed Tracing: The Complete Guide
Last Updated: July 2026 | 13 min read
Quick Answer: Datadog APM (Application Performance Monitoring) traces every request as it flows through your services and shows exactly where time and errors go. A tracing library instruments your code to emit spans; Datadog stitches them into distributed traces and renders them as flame graphs, a Service Map, and per-endpoint latency/error metrics. The mental model is simple: a span is one unit of work, a trace is the whole request, and a service is a named component that emits spans. Enable APM in the Agent, drop in dd-trace for your language, and you go from "the app is slow somewhere" to "this one Postgres query on checkout takes 800 ms."
Metrics tell you the app is slow. Logs tell you what a single process printed. Neither tells you where, across ten services, a request actually spent its time — and that is the question you're really asking during an incident. Datadog APM and distributed tracing answer it directly. This is the traces pillar of observability, and once it's wired to your dashboards and logs, one slow request becomes fully explainable end to end. This guide covers the trace/span/service data model, how instrumentation actually works, reading a flame graph and the Service Map, connecting all three pillars with trace_id, and the sampling-and-retention cost model that keeps the bill sane. If you haven't yet, start by installing the Datadog Agent.
What is Datadog APM?
Datadog APM is the application-tracing product within Datadog that records how requests move through your code and services, so you can pinpoint slow endpoints, failing dependencies, and bottlenecks. It's the third pillar alongside metrics (dashboards) and logs.
Where a metric says "p95 latency is 1.2s" and a log says "payment failed," APM shows the path: the request hit the API gateway, called orders, which called payments, which waited 900 ms on a database lock. It turns "somewhere in the system" into a specific line, service, and query — automatically, for every request you sample.
The APM data model: traces, spans, services, resources
A trace is one request; a span is one operation inside it; a service is a named component; a resource is a specific endpoint or query. Understanding these four terms is the whole foundation — everything in the APM UI is a view over them.
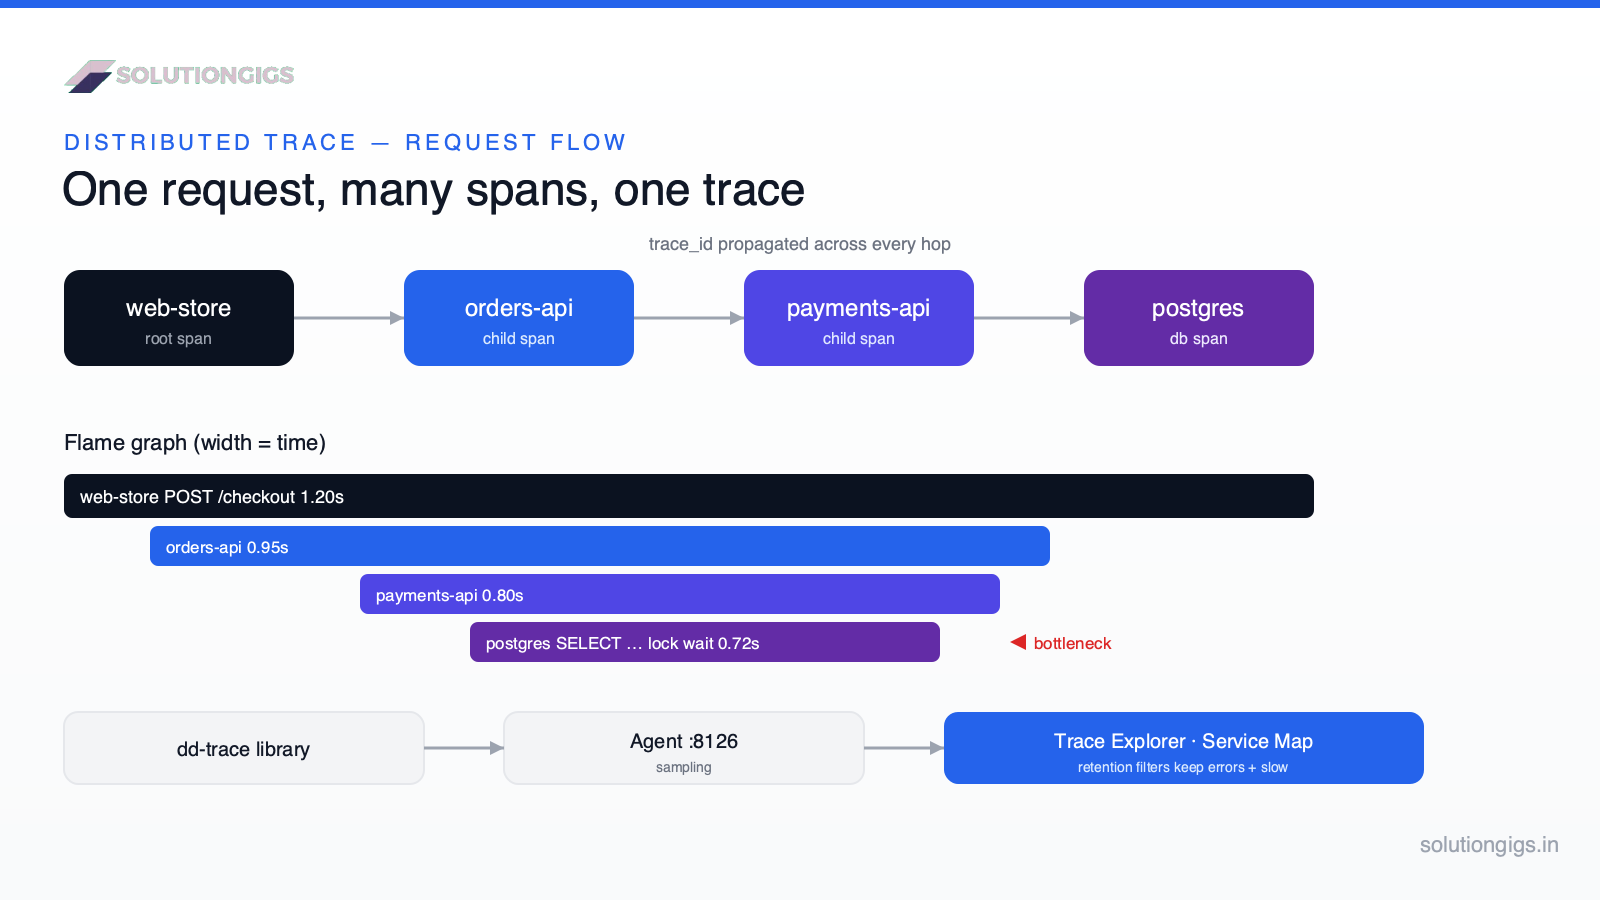
- Span — a single timed unit of work: one DB query, one HTTP call, one function. It has a start time, a duration, a parent span, and tags (
http.status_code,db.statement, etc.). - Trace — the full tree of spans for one request. The first span is the root span; every child records its parent, so the request rebuilds into a flame graph.
- Service — a named component that emits spans (
web-store,payments-api,postgres). Services are the nodes on the Service Map. - Resource — a specific action within a service: an endpoint like
POST /checkoutor a query likeSELECT … FROM orders. This is the grain most latency questions live at.
The relationship is the point: one request produces one trace, made of many spans, grouped by service, bucketed by resource. A trace ID is what threads a request across process boundaries — that propagation is exactly what makes tracing "distributed."
How instrumentation works: auto vs manual
Datadog collects spans through a tracing library (dd-trace) that you load into your application; for most frameworks it auto-instruments common calls with zero code changes. Instrumentation is the act of emitting spans — and you rarely have to write it yourself.
There are two modes:
| Mode | What it is | When to use |
|---|---|---|
| Auto-instrumentation | The tracer monkey-patches known libraries (web frameworks, HTTP clients, DB drivers, caches, queues) and emits spans automatically | The default — covers 80–90% of what you need out of the box |
| Manual (custom) spans | You wrap your own business logic (@tracer.wrap() / tracer.trace()) to time functions the library doesn't know |
For domain logic — "how long does risk scoring take?" |
Datadog's tracers are built on and interoperate with OpenTelemetry, the vendor-neutral tracing standard, so you're not locked into a proprietary format. In practice you start with auto-instrumentation, confirm traces flow, then add a handful of custom spans around the business logic you actually care about.
Step-by-step: setting up APM
Enable APM on the Agent, install the tracing library, run your app through it, and tag it with unified service tagging. Here's the concrete path.
1. Enable APM in the Agent
APM ships with the Agent but the trace intake is off in some setups. Turn it on in datadog.yaml:
apm_config:
  enabled: true
Or via environment variable (Docker/Kubernetes): DD_APM_ENABLED=true. This opens the trace receiver on port 8126 — the port your tracer sends spans to. (If the Agent itself isn't reporting first, fix that before anything else — see Datadog Agent not reporting.)
2. Install the tracing library
Datadog ships dd-trace for Python, Node.js, Java, Go, Ruby, .NET, and PHP. For Python:
pip install ddtrace
DD_SERVICE=payments-api DD_ENV=prod DD_VERSION=1.4.0 ddtrace-run python app.py
ddtrace-run wraps your process and auto-instruments Flask/Django, requests, psycopg, Redis, and more — no code edits. Other languages follow the same shape (a Java -javaagent jar, a Node --require dd-trace/init).
3. Set unified service tagging
Always set DD_SERVICE, DD_ENV, and DD_VERSION. These three tags are what tie traces to the matching metrics and logs, power the version-over-version comparison in Deployment Tracking, and make the Service Map correct. Skipping them is the single most common APM setup mistake.
Reading a trace: flame graph, Service Map, Trace Explorer
The flame graph shows one request's time breakdown, the Service Map shows how services depend on each other, and the Trace Explorer lets you search all traces by any tag. These are the three views you'll live in.
- Flame graph — the waterfall of a single trace. Each bar is a span; width is duration; nesting is the call hierarchy. The long bar is your bottleneck — usually a database or downstream call, not your code.
- Service Map — an auto-generated topology of every service and its dependencies, with request rate, latency, and error rate on each edge. It's the fastest way to see "which dependency is dragging everything down."
- Trace Explorer — search across all indexed traces with queries like
service:payments-api resource_name:"POST /checkout" @duration:>1s status:error, then pivot into any trace.
Every service also gets automatic RED metrics — Rate, Errors, Duration — so you can graph p50/p95/p99 latency and error rate per endpoint on a dashboard without instrumenting a thing yourself.
Connecting the three pillars: trace, log, and metric correlation
Datadog links traces, logs, and metrics through unified service tagging and by injecting the trace_id into your logs — so one investigation spans all three. This correlation is the real payoff of running everything in one platform.
When your logger includes the active trace_id (the tracing libraries can inject it automatically), Datadog connects that log line to its span. The result:
- From a slow trace, jump to the exact log lines that request produced.
- From an error log, open the trace that generated it and see the full request path.
- From a latency spike on a metric dashboard, pivot to example traces from that exact window.
This is the whole argument for co-locating observability. Metrics, logs, and traces answer different questions — is it broken, what happened, where — and correlation is what lets you move between them in seconds instead of copy-pasting IDs between tools.
Trace ingestion, sampling & retention (the cost lever)
Like logs, APM decouples ingesting a span from retaining it — and sampling plus retention filters are how you keep the interesting traces without paying for every one. This is where teams either control the bill or get surprised by it.
You never need every trace. You need every error trace, every slow trace, and a representative sample of the normal ones. Two controls get you there:
- Sampling decides which traces to keep. Head-based sampling decides at the start of a request (cheap, but blind to the outcome). Tail-based-style control decides after the trace completes, based on whether it errored or breached a latency threshold — so you never drop the traces you'd actually investigate.
- Retention filters in Datadog let you keep 100% of error/slow traces and sample the rest, and Datadog's built-in Error and Rare filters retain unusual traces automatically.
| Action | Billed on | How to control |
|---|---|---|
| Run a host with tracing | Per APM host | Right-size which hosts run APM |
| Keep a span searchable | Indexed spans (per retention) | Retention filters — keep errors/slow, sample the rest |
| Emit custom spans | Feeds ingestion volume | Instrument business logic, not every trivial function |
This mirrors the custom-metrics cardinality problem and the logs ingestion-vs-indexing split: cost comes from keeping everything queryable when you only ever query a slice. Before rolling APM out fleet-wide, size the bill with our free Datadog Cost Estimator; if APM dominates, weigh Datadog alternatives.
Alerting on APM
Build monitors on the RED metrics — error rate, latency, and throughput — not on individual traces. APM feeds directly into Datadog monitors.
The high-value APM alerts:
- Error rate on a service or endpoint (
trace.http.request.errorsrate) — page when a service starts failing. - Latency SLO — alert when p95/p99 on a critical resource breaches its target, ideally as an anomaly monitor so seasonal traffic doesn't page you.
- Throughput drop — a sudden fall in request rate often means an upstream is down.
Tie every APM alert to an SLO and a runbook, exactly as you would for any monitor — otherwise you're back to alert fatigue.
Common mistakes to avoid
- Skipping unified service tagging. No
DD_SERVICE/DD_ENV/DD_VERSIONmeans broken correlation, a messy Service Map, and no version comparison. Set them first. - Indexing 100% of traces. The fastest way to a shocking APM bill. Use retention filters — keep errors and slow traces, sample the rest.
- Over-instrumenting with custom spans. A span around every trivial function adds noise and cost. Instrument meaningful business operations only.
- Ignoring the Service Map. It's the single best "what's actually broken" view and teams forget it exists.
- Not injecting
trace_idinto logs. Without it you lose trace-to-log correlation — the biggest reason to run APM and logs together. - Tracing enabled but no data. Usually the Agent APM port (8126) isn't reachable or APM isn't enabled — see agent not reporting.
How SolutionGigs can help
At SolutionGigs we instrument Kafka/Spark/EMR data platforms and the Telemetrix monitoring product with distributed tracing, and the pattern that works is always the same: auto-instrument first, add a few custom spans where the business logic lives, wire trace_id into logs, then use retention filters so you keep every error trace without paying for every healthy one. If you want observability designed to answer incident questions in seconds — not three dashboards and a guess — see how SolutionGigs can help →.
Frequently Asked Questions
What is Datadog APM used for?
Datadog APM is used to find where an application spends time and where it fails. It traces each request across services and shows per-endpoint latency (p50/p95/p99), error rates, throughput, a Service Map of dependencies, and flame graphs of individual requests — so you can pinpoint a slow database query or a failing downstream service instead of guessing from metrics alone.
Is Datadog APM the same as distributed tracing?
Distributed tracing is the technique — following one request across services via a shared trace ID — and Datadog APM is the product built on it. APM adds the tracing libraries, the Agent intake, the Service Map, RED metrics, retention/sampling controls, and the UI (flame graphs, Trace Explorer) on top of the raw distributed traces.
Which languages does Datadog APM support?
Datadog provides official tracing libraries (dd-trace) for Python, Node.js, Java, Go, Ruby, .NET, and PHP, plus C++ and support for OpenTelemetry SDKs. Most web frameworks, HTTP clients, database drivers, and message queues in these languages are auto-instrumented, so you get useful traces without writing span code yourself.
Does Datadog APM require code changes?
Usually no. For most frameworks, running your app through the tracing library (for example ddtrace-run in Python or the -javaagent in Java) auto-instruments web, database, cache, and HTTP calls with zero code changes. You only write code to add custom spans around your own business logic that the library doesn't recognize.
How do I reduce Datadog APM costs?
Use retention filters to keep 100% of error and slow traces while sampling the routine, fast ones; right-size which hosts actually run APM; and avoid over-instrumenting with custom spans on trivial functions. The rule mirrors logs and metrics — ingest broadly, retain narrowly. Estimate the bill first with the Datadog Cost Estimator before a fleet-wide rollout.
What is the difference between APM and RUM in Datadog?
APM traces requests on the server side — services, databases, backends. RUM (Real User Monitoring) captures the browser/mobile side — page loads, JavaScript errors, and user interactions. When both are enabled, Datadog links a frontend RUM action to the backend APM trace it triggered, giving you the full path from a user's click to the database query behind it.
Conclusion
Datadog APM turns "the app is slow" into a specific service, endpoint, and query — because it traces the actual path of every request instead of sampling symptoms from the outside. Get the data model straight (a span is one operation, a trace is one request, a service emits spans, a resource is the endpoint), enable APM on the Agent, drop in dd-trace, and set unified service tagging so traces, logs, and metrics correlate. Then use retention filters and sampling to keep every error and slow trace while paying for only a fraction of the healthy ones. Do that and APM stops being an expensive mystery and becomes the fastest tool in an incident — the one that answers where in seconds. Wire it to your dashboards, monitors, and logs and you finally have all three pillars working as one.
Rolling out tracing across a fleet and want to size the bill before it surprises you? Use our free Datadog Cost Estimator, or get help from SolutionGigs → to design tracing that stays complete without going broke.

Mohammed Yaseen
Founder, SolutionGigs
Mohammed instruments distributed tracing across Kafka/Spark/EMR data platforms and builds Telemetrix, an infrastructure-monitoring product — much of it spent making one slow request explainable end to end without a runaway APM bill. LinkedIn →