
Datadog RUM: Real User Monitoring Explained
Last Updated: July 2026 | 12 min read
Quick Answer: Datadog RUM (Real User Monitoring) measures the experience of real users in your web and mobile apps — page load speed, Core Web Vitals, JavaScript errors, slow resources, and every click in a session. A browser or mobile SDK runs in the user's app and streams events to Datadog, organized as sessions → views → actions → resources → errors. It's the front-end counterpart to APM: APM traces your servers, RUM watches the browser, and Datadog links a user's click to the exact backend trace it triggered. Add Session Replay and you can literally watch what a user did before an error.
Your server-side metrics can look perfect while users are staring at a blank screen. Your p95 latency is 200 ms, your error rate is flat — and yet a slow third-party script, a layout shift, or a JavaScript exception is quietly ruining the experience for real people on real devices. Datadog RUM exists to close that gap: it measures what the user actually experiences, not what your backend thinks it served. This is the front-end pillar that turns APM into a full picture — from a user's click, through the browser, all the way to the database query. This guide covers the RUM data model, Core Web Vitals, RUM vs APM vs Synthetics, browser-SDK setup, Session Replay, RUM-to-APM linking, and the session-based cost model. New to Datadog? Start by installing the Agent.
What is Datadog RUM?
Datadog RUM is the real-user-monitoring product that captures front-end performance and behavior from actual visitors' browsers and mobile devices. It answers the question metrics and logs can't: what did the user actually experience?
Where APM instruments your servers, RUM instruments the client. It records how fast pages loaded for real people, which interactions were sluggish, what JavaScript errors fired, and how users moved through the app — segmented by browser, device, country, and version. It's the difference between "the API returned 200 in 180 ms" and "users in India on 3G waited 6 seconds for the checkout page to become usable."
RUM vs APM vs Synthetic monitoring
RUM measures real users on the client, APM traces requests on the server, and Synthetic monitoring uses scripted robots to proactively test your app — they're complementary, not competing. Confusing them is the most common Datadog front-end mistake.
| What it monitors | Data source | Best for | |
|---|---|---|---|
| RUM | Real users' browsers/mobile | SDK in the user's app | True experience, Core Web Vitals, JS errors, real-world variety |
| APM | Back-end services & databases | Tracing library on servers | Where server time goes, slow queries, service errors |
| Synthetic | Scripted uptime/flow checks | Datadog robots on a schedule | Proactive uptime, critical flows, pages with no traffic |
The one-line verdict: Synthetics tell you the site is up; RUM tells you the site is good; APM tells you why it isn't. Most mature teams run all three and correlate them.
The RUM data model: sessions, views, actions, resources, errors
RUM organizes everything into a hierarchy: a session contains views, and each view contains actions, resources, errors, and long tasks. Learn these five nouns and the entire RUM UI makes sense.
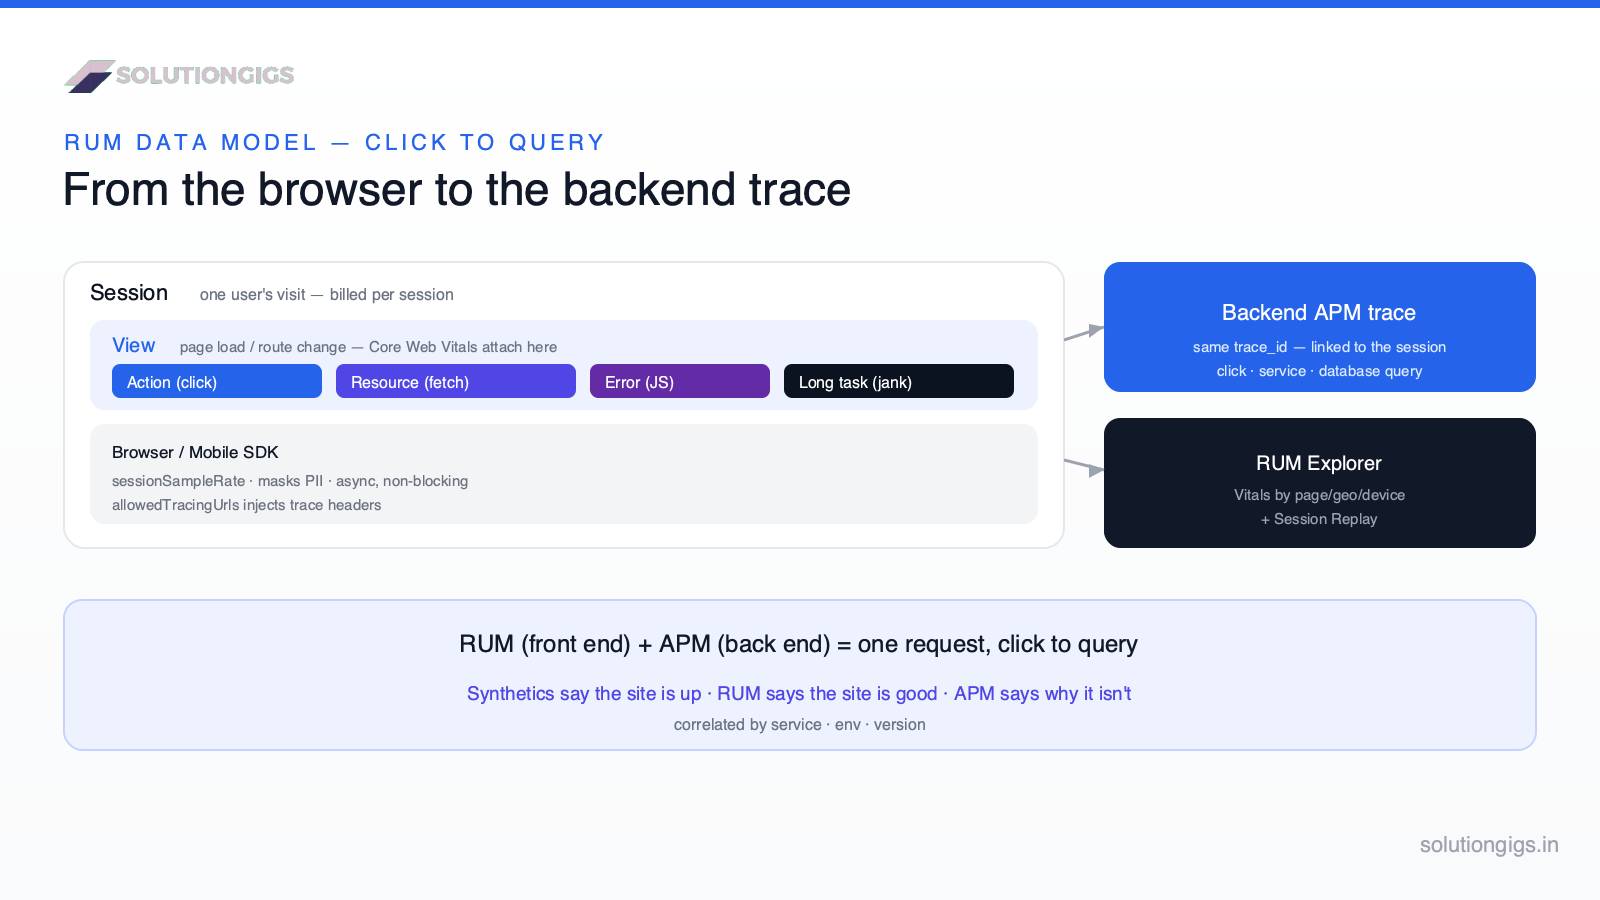
- Session — one user's visit: a rolling window of their activity (expires after ~15 min idle or 4 h). Billing is per session.
- View — a single page load or route change (in SPAs, each client-side navigation is a view). Core Web Vitals attach here.
- Action — a user interaction: a click, tap, or custom action like "Add to cart."
- Resource — a network request the page made: XHR/fetch, images, scripts, CSS. This is where a slow API or fat asset shows up.
- Error — a JavaScript exception, failed request, or crash, with stack trace and source map support.
Plus long tasks (main-thread blocks > 50 ms) that explain jank. Every one of these events carries the session, view, browser, device, and geo context — so you can slice "LCP by country" or "errors by app version" instantly.
What RUM captures: Core Web Vitals and front-end health
RUM automatically captures Google's Core Web Vitals plus the full loading timeline and every front-end error — no manual instrumentation. These are the numbers that actually correlate with user satisfaction and SEO.
The Core Web Vitals, measured on real page views:
- LCP (Largest Contentful Paint) — loading: when the main content becomes visible. Good < 2.5 s.
- INP (Interaction to Next Paint) — responsiveness: how quickly the page reacts to input. Good < 200 ms. (INP replaced First Input Delay as a Core Web Vital in 2024.)
- CLS (Cumulative Layout Shift) — visual stability: how much the layout jumps. Good < 0.1.
RUM also records First Contentful Paint, Time to First Byte, resource timings, and JS errors with source-mapped stack traces. Because these are Google's own ranking signals (see web.dev on Core Web Vitals), RUM doubles as an SEO instrument, not just an ops one.
Step-by-step: setting up Datadog RUM
Create a RUM application to get credentials, install the browser SDK, initialize it, and enable APM linking. Here's the concrete path for web.
1. Create a RUM application
In Datadog, go to Digital Experience → RUM Applications → New Application, pick "Browser," and copy the generated applicationId and clientToken. (The client token is safe to expose in front-end code; it can only send data in.)
2. Install and initialize the browser SDK
Install via npm (npm i @datadog/browser-rum) or the CDN snippet, then initialize early in your app:
import { datadogRum } from '@datadog/browser-rum';

datadogRum.init({
  applicationId: '<APPLICATION_ID>',
  clientToken: '<CLIENT_TOKEN>',
  site: 'datadoghq.com',            // must match your DD_SITE region
  service: 'web-store',
  env: 'prod',
  version: '1.4.0',
  sessionSampleRate: 20,            // % of sessions to keep
  sessionReplaySampleRate: 5,       // % to record for Session Replay
  trackUserInteractions: true,
  allowedTracingUrls: ['https://api.web-store.com'],  // links RUM → APM
});
Two things matter most: site must match your DD_SITE region (US1/EU/etc.) or data vanishes, and allowedTracingUrls is what connects front-end sessions to back-end traces.
3. Mobile
For native apps, use the iOS, Android, or React Native RUM SDK — same session/view/action model, plus mobile-specific signals like app-start time, frozen frames, and crash reporting.
Session Replay: watch what the user actually did
Session Replay reconstructs a privacy-safe, video-like playback of a real user's session from RUM events — not a screen recording. It's the fastest way to understand a bug report.
Instead of "it's broken on my end," you watch the exact clicks, scrolls, and navigation that led to an error or a rage click (rapid repeated clicks signaling frustration). Sensitive inputs are masked by default for privacy. Replay is sampled and billed separately from base RUM sessions, so teams typically record a small fraction (e.g. 5%) of traffic — enough to catch patterns without the full cost.
Connecting RUM to APM: the full request path
When allowedTracingUrls is set, Datadog links a RUM resource to the APM trace it generated — so you follow one request from the user's click to the database query. This is the payoff of running both.
The flow: a user clicks "Checkout" → RUM records the action and the resource (the fetch to your API) → the SDK injects tracing headers → your backend tracing library picks them up → the resulting server-side trace is linked back to the RUM session. From a slow front-end view you jump straight into the flame graph; from a backend error you see which real user hit it.
This closes the observability loop. RUM (front end) + APM (back end) + logs + metrics/dashboards, all correlated by
service,env, and IDs — one investigation from click to query, no tool-hopping.
Sampling and the RUM cost model
RUM is billed per thousand sessions, and the sessionSampleRate is your primary cost control — sample a representative slice rather than recording everyone. Cost scales with traffic, so this matters more than it does for host-based products.
sessionSampleRate— the % of user sessions RUM keeps. A well-chosen sample (e.g. 10–30% for high-traffic apps) preserves statistical accuracy at a fraction of the cost.sessionReplaySampleRate— a smaller % recorded for Session Replay, which is billed on top.
| Lever | Controls | Typical setting |
|---|---|---|
sessionSampleRate |
Base RUM session volume/cost | 10–100% by traffic |
sessionReplaySampleRate |
Replay cost (billed separately) | Small % of sessions |
| Retention | How long sessions stay searchable | Per plan |
This echoes the same principle as APM sampling, log ingestion-vs-indexing, and custom-metric cardinality: capture broadly, retain a representative slice. Sizing a rollout? Use our free Datadog Cost Estimator; if front-end monitoring dominates the bill, weigh Datadog alternatives.
Common mistakes to avoid
- Setting the wrong
site. Ifsitedoesn't match your Datadog region, RUM data silently never arrives — the #1 "it's not working" cause. - Recording 100% of sessions. The fastest way to a surprise RUM bill. Sample, and replay an even smaller fraction.
- Skipping
allowedTracingUrls. Without it you lose RUM-to-APM linking — the single most valuable RUM feature. - No source maps. JS errors without uploaded source maps are unreadable minified noise. Upload them in CI.
- Ignoring INP. Many teams still watch old FID; INP is the current Core Web Vital for responsiveness — track it.
- Treating RUM as a replacement for Synthetics. RUM only sees pages with traffic; you still need Synthetic checks for uptime and untrafficked flows.
How SolutionGigs can help
At SolutionGigs we wire RUM and APM together on the products we build — including Telemetrix, our infrastructure-monitoring platform — so a user's slow checkout links straight to the backend trace and log lines behind it. The pattern that works: enable RUM-to-APM linking from day one, sample sessions sensibly, upload source maps in CI, and put Core Web Vitals on the same dashboard as your backend RED metrics. If you want front-end and back-end observability that actually connect, see how SolutionGigs can help →.
Frequently Asked Questions
What does Datadog RUM measure?
Datadog RUM measures the real front-end experience: page load speed, Core Web Vitals (LCP, INP, CLS), JavaScript errors with stack traces, slow network resources, user actions (clicks, taps, navigation), and long tasks that block the main thread — all captured from actual users' browsers and mobile devices and segmented by page, browser, device, version, and country.
Is Datadog RUM free?
Datadog RUM is a paid product billed per thousand sessions, with Session Replay charged separately. Datadog offers a free trial and a limited free tier for evaluation, but production RUM at real traffic volumes is billed on session count. The sessionSampleRate setting lets you control cost by capturing a representative percentage of sessions rather than every visit.
Does Datadog RUM slow down my website?
The RUM browser SDK is lightweight and loads asynchronously, so its impact on page performance is minimal. It batches events and sends them in the background without blocking rendering. The main considerations are the small SDK download and keeping sessionSampleRate sensible; neither meaningfully affects the user experience it's measuring.
Can Datadog RUM track single-page applications (SPAs)?
Yes. The RUM SDK understands client-side routing in React, Angular, Vue, and other SPA frameworks, creating a new "view" for each route change rather than only on full page loads. This gives accurate per-route performance, Core Web Vitals, and error tracking even when the browser never does a traditional navigation.
How does RUM connect to backend traces?
When you set allowedTracingUrls in the SDK, RUM injects distributed-tracing headers into matching requests. Your backend tracing library reads them and links the resulting APM trace to the originating RUM session, so you can pivot from a slow front-end action straight to the server-side flame graph and the database query behind it.
What is a session in Datadog RUM?
A session is one user's continuous visit — a rolling window of their views and actions that ends after about 15 minutes of inactivity or 4 hours total. Sessions are the unit Datadog bills RUM on, which is why the sessionSampleRate is the key cost lever: you sample a representative fraction of sessions instead of recording every visitor.
Conclusion
Datadog RUM measures what your users actually experience — not what your servers think they served — and that's the blind spot backend monitoring can't cover. Get the model straight (a session holds views, each with actions, resources, and errors), drop in the browser SDK with the right site and a sensible sessionSampleRate, upload your source maps, and turn on allowedTracingUrls so a user's click links to the APM trace behind it. Do that and you get Core Web Vitals, real-user error tracking, and Session Replay — plus the full path from click to query when you pair it with APM, logs, and dashboards. RUM is the pillar that finally puts the user back in your observability.
Rolling out front-end monitoring and want to size the bill first? Use our free Datadog Cost Estimator, or get help from SolutionGigs → to connect RUM and APM into one investigation.

Mohammed Yaseen
Founder, SolutionGigs
Mohammed connects real-user monitoring to backend tracing on the products he builds, including Telemetrix — much of it spent making a user's slow page link straight to the database query behind it. LinkedIn →