
Fix Kafka Consumer Lag and Kinesis ProvisionedThroughputExceededException in Production
Kafka consumer lag and Kinesis ProvisionedThroughputExceededException are one incident in two uniforms: a partition or shard taking in more than it can hand off. The 15-minute triage, fixes in blast-radius order, and why retries turn a slowdown into an outage. A production break-fix runbook: read the lag shape or the per-shard throttle metric, match one of four faults, then fix consumers, poll size, partition keys and retry budgets in the right order — and what to do if it is still red.

Quick Answer: Kafka consumer lag and Kinesis ProvisionedThroughputExceededException are the same incident wearing two uniforms: the pipeline is taking in more than one unit of it can process. On Kafka the unit is a partition and the fix is consumer count, then poll size, then rebalance settings. On Kinesis the unit is a shard, with a hard 1 MB/s write and 2 MB/s read limit, and the fix is stopping the retry storm, then the partition key, then shard count. In both cases, retrying harder is what turns a slowdown into an outage.
It is 2 a.m. and the dashboard says the order-events consumer is 1.4 million messages behind. Or the producer logs are a wall of ProvisionedThroughputExceededException and the retry counter is climbing faster than the success counter. The on-call engineer restarts the service, lag drops for ninety seconds, then climbs again. That restart is the most common first move and it is almost always wrong.
This is the runbook we use when a client sends us that screenshot. It covers the fifteen-minute triage that tells you which of four faults you actually have, the fixes in the order that stops the bleeding first, and the retry mistake that appears in nearly every Kinesis incident we have been asked to look at. If you want the fundamentals first, the Kafka consumer lag explainer covers the offset math; this post assumes you are already on fire.
Same symptom, different fault: the 15-minute triage
The first fifteen minutes decide whether the incident lasts thirty minutes or six hours. Do not change any configuration until you have read the shape of the problem.
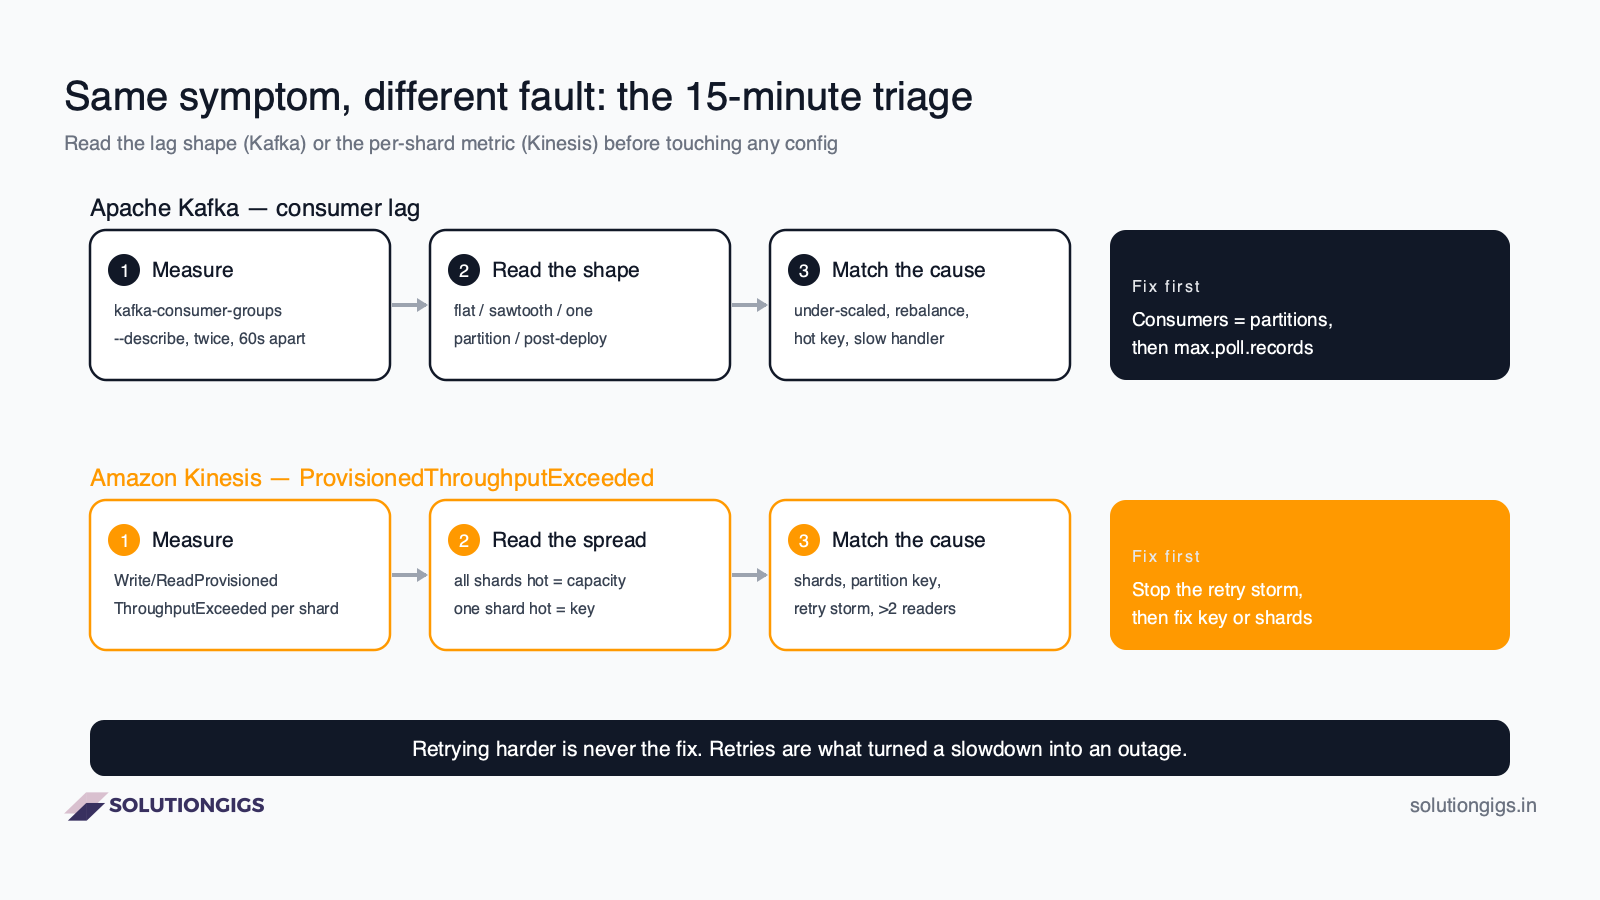
Both lanes have the same three steps. Measure at the unit level (partition or shard), read the pattern, and only then pick a fix. The table is the whole diagnosis compressed:
| What you see | Kafka | Kinesis | Real fault |
|---|---|---|---|
| Every partition/shard behind, line flat or climbing steadily | lag on all partitions | WriteProvisionedThroughputExceeded on all shards |
Under-provisioned. More consumers (Kafka) or more shards (Kinesis) |
| One partition/shard behind, the rest healthy | one partition with 90% of the lag | one shard with all the throttles | Hot key. Fix the partition key, not the capacity |
| Lag drops to zero then jumps, over and over | sawtooth, "rebalancing" in logs | retries succeed then throttle again in bursts | Kafka: rebalance storm. Kinesis: retry storm |
| Started climbing right after a deploy | lag grows from the deploy timestamp | throttles begin at the deploy timestamp | Slow handler regression or a new producer. Roll back first, tune second |
The restart-and-hope move only works on the third row, and only for ninety seconds, because it triggers exactly the rebalance or retry burst that produced the sawtooth.
Part 1 — Kafka consumer lag in production
Kafka consumer lag is the number of messages between the last offset a consumer group committed and the newest offset on the partition. It becomes an incident when it grows for longer than your consumers can catch up after the burst ends.
Step 1: Measure twice, 60 seconds apart
Run the built-in tool twice. Lag that is falling is a recovering consumer and needs no action; lag that is rising is the incident.
kafka-consumer-groups.sh --bootstrap-server broker:9092 \
  --describe --group order-events-consumer

# GROUP                 TOPIC   PARTITION  CURRENT-OFFSET  LOG-END-OFFSET  LAG      CONSUMER-ID
# order-events-consumer orders  0          8812345         8812390         45       consumer-1-...
# order-events-consumer orders  1          8801122         9412870         611748   consumer-1-...
# order-events-consumer orders  2          8823901         8823950         49       consumer-2-...
# order-events-consumer orders  3          8790011         8790100         89       consumer-2-...
That output is already a diagnosis. Partition 1 holds 99.9% of the lag while the others are healthy: this is a hot key, and no amount of scaling fixes it. Two consumers sharing four partitions, all behind evenly, would be an under-scaled group.
If you run Datadog, the same read is one query on kafka.consumer_lag grouped by partition; the Datadog Kafka lag monitoring guide has the exact monitor.
Step 2: Read the shape
Four shapes cover nearly every production lag incident.
- Flat-high or steady climb on all partitions — throughput deficit. Consumers cannot keep up with producers at all.
- Sawtooth — rebalance storm. A consumer exceeds
max.poll.interval.ms(default 5 minutes), is kicked from the group, the group rebalances, partitions are reassigned, everyone re-fetches, and the cycle repeats. - One partition — hot key. A single
customer_id,tenant_idornullkey routes most traffic to one partition. - Climb from a timestamp — a regression. A deploy added a synchronous HTTP call, a slower serializer, or a database lock inside the poll loop.
Step 3: Fix in blast-radius order
Cheapest and most reversible first. Each step is enough on its own for a large share of incidents; do not stack them blindly.
1. Match consumers to partitions. A partition is consumed by at most one consumer in a group, so a 12-partition topic with 3 consumers runs at 25% of its ceiling. Scale the consumer deployment to the partition count. Anything beyond that sits idle.
2. Tune the poll, not the code. If per-message work is slow, a large max.poll.records (default 500) means one poll takes longer than max.poll.interval.ms, the consumer is evicted, and you get shape 2. Either lower max.poll.records or raise max.poll.interval.ms. Both are a config change, not a deploy.
# consumer.properties — the four settings that end most lag incidents
max.poll.records=100                 # smaller polls finish inside the interval
max.poll.interval.ms=600000          # 10 min: room for the slow batch, not the default 5
session.timeout.ms=45000             # default since Kafka 3.0; leave it
group.instance.id=order-consumer-${HOSTNAME}   # static membership: restarts do not rebalance
partition.assignment.strategy=org.apache.kafka.clients.consumer.CooperativeStickyAssignor
3. Stop the rebalance storm. Static membership (group.instance.id) lets a consumer restart and reclaim its partitions without a rebalance. CooperativeStickyAssignor makes the rebalances that do happen incremental instead of stop-the-world. On Kafka 4.0 and later, the new consumer rebalance protocol from KIP-848 (group.protocol=consumer) moves assignment to the broker and removes the global synchronisation barrier entirely; if you are on 4.x and still seeing sawtooth lag, that one setting is worth the upgrade.
4. Fix the hot key. Add a suffix to the key (customer_id + "-" + bucket) so the hot tenant spreads across N partitions, or route the top-tenants to a dedicated topic. This changes ordering guarantees for that key, so confirm the consumer does not depend on strict per-key order before you do it.
5. Batch the downstream. The most common slow handler is one database write or one HTTP call per message. Buffer the poll result and write it in one batch; a 500-record INSERT is not 500 times slower than a single one. The Spark Streaming tuning guide covers the same principle for micro-batch sinks.
6. Add partitions — last. Adding partitions is permanent, remaps every keyed producer's key-to-partition assignment, and helps only after steps 1–5 are exhausted. If you do it, do it once, generously, during a quiet window. The Kafka fundamentals post explains why the remap matters.
What to do at 2 a.m. versus what to do on Monday
At 2 a.m., only steps 1 and 2 are safe. They are config or replica-count changes, they are reversible, and they do not touch the topic. Steps 3–6 change behaviour and need a review. The on-call goal is to get lag falling, not to fix the architecture.
Part 2 — Kinesis ProvisionedThroughputExceededException and the retry storm
ProvisionedThroughputExceededException is Amazon Kinesis Data Streams telling you that one shard received more than its per-shard limit in one second. It is not a stream outage and it is not an SDK bug; the limit is fixed, per shard, and documented in the Kinesis service quotas.
| Direction | Per-shard limit | The number that usually bites |
|---|---|---|
| Write | 1 MB/s or 1,000 records/s, whichever is hit first | 1,000 small records/s from one partition key |
| Read (shared) | 2 MB/s, and at most 5 GetRecords calls/s across all consumers of that shard |
A third consumer application on the same stream |
PutRecords call |
500 records, 5 MB total, 1 MB per record | Batches sized by count, not bytes |
Two things about this table cause most incidents. The write limit is per shard, so a stream with 20 shards and 20 MB/s of headroom still throttles when a single partition key sends 1.2 MB/s to one shard. And the read limit is shared across every consumer of a shard, so the second and third application reading the stream compete for the same 5 calls per second.
Why retries make it worse
Every retried record goes back to the same hot shard, within the same one-second window, alongside the new records still arriving. The AWS SDKs retry throttled calls automatically — boto3's legacy retry mode makes up to 5 attempts per call and its standard mode 3 — and the Kinesis Producer Library (KPL) keeps retrying until the record's TTL expires, 30 seconds by default. Application code often wraps all of that in its own retry loop.
The arithmetic is unforgiving. A shard that is 10% over its limit rejects 10% of records. Those records come back next second together with the next second's full load, so now it is 20% over. Within a few seconds the shard is rejecting most of what it receives, the producer's memory fills with unsent records, and the incident that started as a small overload looks like a stream that is down. The AWS backoff-and-jitter article is the canonical explanation of why retries without jitter synchronise into waves.
Step 1: Measure the spread, not the total
Open CloudWatch and look at the throttle metric per shard, which needs shard-level enhanced monitoring enabled:
aws kinesis enable-enhanced-monitoring --stream-name orders \
  --shard-level-metrics WriteProvisionedThroughputExceeded ReadProvisionedThroughputExceeded IncomingBytes IncomingRecords
Then read three metrics side by side:
WriteProvisionedThroughputExceededandReadProvisionedThroughputExceeded— which side is throttled, and on which shards.IncomingBytesandIncomingRecordsper shard — whether you are hitting the byte limit or the record-count limit. 1,000 tiny records per second throttles a shard that is carrying 50 KB/s.GetRecords.IteratorAgeMilliseconds— how far behind the consumer is in time. This is the Kinesis equivalent of consumer lag, and it is the metric you alert on.
Step 2: Read the spread
- All shards throttling together — genuine capacity shortfall. You need more shards, or on-demand mode, or fewer bytes per record.
- One or two shards throttling — a hot partition key. More shards will not help, because the key still hashes to one shard.
ReadProvisionedThroughputExceededonly — too many consumer applications sharing the 2 MB/s. The fix is enhanced fan-out, not shards.- Throttling in short bursts that recover then return — a retry storm amplifying a spike that would otherwise have passed.
Step 3: Fix in blast-radius order
1. Stop the retry storm first. Cap total retry time, add full jitter, and retry only the failed records. This is a code change, but it is the one change that turns every other fix from "maybe" into "works". Here is the shape in Python with boto3; the same logic applies to the Java and Go SDKs.
import random, time, boto3

kinesis = boto3.client("kinesis")
MAX_ATTEMPTS = 5
BASE, CAP = 0.1, 2.0   # seconds

def put_records(stream, records):
    """records: list of {"Data": bytes, "PartitionKey": str}. Retries ONLY the
    entries Kinesis rejected, with full-jitter backoff. Returns records that
    still failed after MAX_ATTEMPTS so the caller can spill them, not drop them."""
    pending = records
    for attempt in range(MAX_ATTEMPTS):
        resp = kinesis.put_records(StreamName=stream, Records=pending)
        if resp["FailedRecordCount"] == 0:
            return []
        # HTTP 200 with partial failure: pick out only the rejected entries
        pending = [rec for rec, res in zip(pending, resp["Records"]) if "ErrorCode" in res]
        sleep = random.uniform(0, min(CAP, BASE * 2 ** attempt))   # full jitter
        time.sleep(sleep)
    return pending   # caller writes these to S3/SQS, never discards them
Three details in that code matter more than the backoff formula. The response is HTTP 200 even when records failed, so FailedRecordCount is the only truth. Only the entries with an ErrorCode are resent, so the successful ones are not duplicated. And after the last attempt the records are returned rather than dropped, so the caller can spill them to S3 or SQS and replay later.
2. Fix the partition key. A good Kinesis partition key has high cardinality and even distribution. user_id is usually fine; region, event_type, tenant_id with one giant tenant, or a constant string are not. When one key must be hot, spread it explicitly: append a random suffix from a small range (tenant-42-0 … tenant-42-7) so that tenant lands on up to eight shards. The consumer has to tolerate that tenant's records arriving out of order across shards.
3. Batch with PutRecords, size by bytes and count. Replace per-event PutRecord calls with PutRecords batches of up to 500 records or 5 MB, whichever comes first. Single calls hit the 1,000 records/s limit long before the byte limit. If you use the KPL, aggregation packs many small user records into one Kinesis record and is the single largest throughput win available; the consumer must deaggregate (the KCL does it for you).
4. Add read capacity with enhanced fan-out, not shards. If only ReadProvisionedThroughputExceeded fires, register each consumer application with RegisterStreamConsumer and read with SubscribeToShard. Each registered consumer gets its own 2 MB/s per shard instead of sharing one pipe, and Kinesis pushes records instead of being polled five times a second. Up to 20 consumers per stream can be registered by default.
5. Then, and only then, add shards. UpdateShardCount scales a provisioned stream, at most doubling per call, with a daily quota on scaling operations, so plan the target rather than nudging it. Or switch the stream to on-demand mode, which scales capacity to roughly twice the previous peak automatically. On-demand does not change the per-shard limit, so the hot-key fix still has to happen; it removes the shard-count chore, not the design problem.
Kafka versus Kinesis: the same fix in two vocabularies
| Fix | Kafka | Kinesis |
|---|---|---|
| The unit that is overloaded | Partition | Shard |
| Measure it | kafka-consumer-groups --describe, lag per partition |
CloudWatch shard-level *ProvisionedThroughputExceeded, IteratorAgeMilliseconds |
| Hot key | One partition with most of the lag | One shard with all the throttles |
| Scale the reading side | More consumers, up to the partition count | Enhanced fan-out per consumer application |
| Scale the unit count | Add partitions (permanent, remaps keys) | UpdateShardCount or on-demand mode |
| The setting that stops the storm | group.instance.id + CooperativeStickyAssignor (or KIP-848 on 4.x) |
Retry budget + full jitter + retry only failed records |
| Time-based lag metric | Build it from record timestamps or use a lag exporter | GetRecords.IteratorAgeMilliseconds, built in |
If you are choosing between the two systems rather than fixing one, the Kafka vs Kinesis vs Pub/Sub comparison covers the trade-offs; the short version is that Kafka gives you more knobs and Kinesis gives you fewer knobs and a bill.
Mistakes that turn a 30-minute incident into a 6-hour one
- Restarting the consumer group. On Kafka this forces a full rebalance — the exact thing producing the sawtooth. On Kinesis a restarted KCL worker re-leases every shard and replays from the checkpoint, adding a burst on top of the backlog.
- Raising the retry count. Each increase multiplies the load on the shard that was already refusing traffic. The fix is fewer, jittered, targeted retries.
- Alerting on lag as an absolute number. A backlog of 50,000 that is shrinking is fine; one of 5,000 that has been growing for 15 minutes is not. Alert on the rate and on iterator age.
- Adding partitions or shards to a hot-key problem. The key still hashes to one unit. Capacity changes cannot fix distribution.
- Reading the HTTP status of
PutRecords. It is 200 on partial failure. ReadFailedRecordCount. - Skipping the checkpoint or commit review. A consumer that commits before processing loses records on eviction; one that never commits replays everything after a restart. Both look like lag.
Prevention: the four alerts that catch this before 2 a.m.
- Lag growth, not lag level: consumer lag (or
IteratorAgeMilliseconds) increasing for 5 consecutive minutes. - Rebalance rate: more than N rebalances per hour on a consumer group means a
max.poll.interval.msviolation is coming. - Per-unit skew: the maximum partition or shard lag divided by the median exceeds 5×. This catches hot keys a week before they throttle.
- Throttle rate: any non-zero
WriteProvisionedThroughputExceededat the shard level, because throttling is silent in the application logs until the retries give up.
The full monitor definitions, with Datadog and Prometheus versions, are in the Kafka consumer lag guide.
Still broken? This is how I fix it for teams
Everything above is what a good engineer does by hand during an incident. It is also exactly what should not be done by hand a second time. When a team sends me a lag or throttling incident, the fix ships as automation that stays in their repository, so the next spike resolves itself.
01 · Detect
Rate-based lag and throttle alerts
Lag growth, iterator age, rebalance rate and per-shard throttles wired into Datadog, Grafana or CloudWatch — alerting on the trend, not a magic number, so the page fires 20 minutes before customers notice.
02 · Contain
Retry budget and partial-failure handling
The producer path rewritten so retries are capped, jittered and targeted at failed records only, with a spill-to-S3 or dead-letter path for what still fails. The retry storm cannot happen again by construction.
03 · Diagnose
Hot-key and hot-shard detector
A scheduled job that samples partition keys and reports skew per partition or shard, with the top keys named. Hot tenants are found on a Tuesday dashboard, not in a Saturday incident.
04 · Scale
Autoscaling that follows the backlog
Kafka consumers scaled on lag with KEDA or the equivalent on ECS; Kinesis shards or on-demand mode sized from real IncomingBytes with a capacity plan that says what the next 10× costs.
05 · Harden
Consumer configuration that survives restarts
Static membership, cooperative rebalancing or the KIP-848 protocol, poll sizing, pause/resume backpressure and checkpoint placement reviewed and committed, with the reasoning written next to each setting.
06 · Hand over
A runbook your on-call can run without me
The triage in this post, specific to your topics and shards, with the commands, the dashboards and the rollback steps. The goal is that you never need to send the second query.
How the money works. Send the query, the screenshot, the logs, whatever you have, at solutiongigs.in/fix. There is no charge to look at it, no deposit, and no hourly meter. I diagnose it, tell you in writing what is wrong and what fixing it costs, and you pay only when the fix is in and verified in your environment. If I cannot fix it, you pay nothing and I tell you who or what would. I am not in the business of asking for payment; I am in the business of getting lag to zero. For ongoing streaming, ETL and observability work rather than a single fire, the services page explains how an engagement runs.
Frequently Asked Questions
What does ProvisionedThroughputExceededException mean in Kinesis?
It means a single shard received more than its fixed limit — 1 MB/s or 1,000 records/s for writes, or 2 MB/s and 5 GetRecords calls/s for reads — in that second. It is a per-shard limit, so a stream with plenty of total capacity still throws it when one partition key sends most of the traffic to one shard. The stream is not down; that one shard is refusing the excess.
Why do retries make Kinesis throttling worse?
Because every retried record lands on the same hot shard, within the same second window, alongside the new traffic that is still arriving. The SDK retries several times per call and the Kinesis Producer Library retries until its record TTL expires (30 seconds by default), so a shard that was 10% over its limit is soon 300% over it. Retries only help when the overload is a short spike and the backoff has jitter.
How do I tell whether Kafka lag is a capacity problem or a rebalance problem?
Plot lag per partition over ten minutes. A capacity problem is a flat or steadily climbing line on every partition. A rebalance problem is a sawtooth: lag drops to near zero, then jumps, repeatedly, and the consumer logs show the group re-joining. Lag on a single partition while the others are healthy is a hot key, not a capacity problem at all.
Should I add Kafka partitions to fix consumer lag?
Only after the consumer count already equals the partition count and per-message processing time is already as low as it can go. Adding partitions is permanent, changes key-to-partition mapping for every keyed producer, and does nothing if the bottleneck is a slow downstream call. Scale consumers first, then tune max.poll.records and batch the downstream writes; add partitions last.
Does Kinesis on-demand mode eliminate ProvisionedThroughputExceededException?
No. On-demand mode scales the stream's total capacity automatically, but each shard still has the same per-shard limit, so a hot partition key still throttles. It also scales to roughly double the previous peak, so a step change bigger than that throttles until capacity catches up. On-demand removes the shard-count chore, not the partition-key design.
What is a safe alert threshold for Kafka consumer lag?
Alert on the rate of change, not a fixed number of messages. A lag of 50,000 that is falling is a recovering consumer; a lag of 5,000 that has been growing for 15 minutes is an incident. Pair a lag-growth alert (lag increasing for N consecutive minutes) with a time-based one — how many seconds behind the newest record the consumer is — which Kinesis exposes directly as IteratorAgeMilliseconds.
How do I handle partial failures from a Kinesis PutRecords call?
Check FailedRecordCount in the response, not the HTTP status — PutRecords returns 200 even when some records were throttled. Collect the records whose entry carries an ErrorCode, wait with exponential backoff plus jitter, and retry only those records. Retrying the whole batch duplicates the records that already succeeded.
Conclusion
Kafka consumer lag and Kinesis ProvisionedThroughputExceededException are one problem: a partition or a shard receiving more than it can hand off. The triage is the same in both worlds — measure per unit, read the shape, match the cause — and the fixes go in the same order, cheapest and most reversible first. On Kafka that means consumers up to the partition count, then poll sizing, then static membership and cooperative rebalancing, and partitions last. On Kinesis it means stopping the retry storm, then the partition key, then batching and enhanced fan-out, and shards last.
The one rule that holds everywhere: retrying harder is never the fix. The retry loop is what converts a ten-minute overload into a multi-hour outage, on both platforms, and it is the first thing to remove.
If the dashboard is still red after all of this, send the query. Looking at it costs nothing, and you pay only once the fix is verified in your environment.
Mohammed Yaseen
Founder, SolutionGigs
Data engineer who has spent a lot of nights watching lag graphs on Kafka, Kinesis and Spark Structured Streaming, and now fixes them for other teams through solutiongigs.in/fix. LinkedIn →
More in Data Engineering

AI and Data Engineering: What Really Changes and What Doesn't
AI changed data engineering in two directions at once, and most articles only cover one: agents that write pipelines, and pipelines that serve models. This guide separates them, then defines what "AI-ready data" actually means as a specification rather than a slogan - a ten-dimension comparison against the BI-ready standard, a decision table for what to delegate to agents and what to never hand over, and a 90-day plan to get a platform ready.
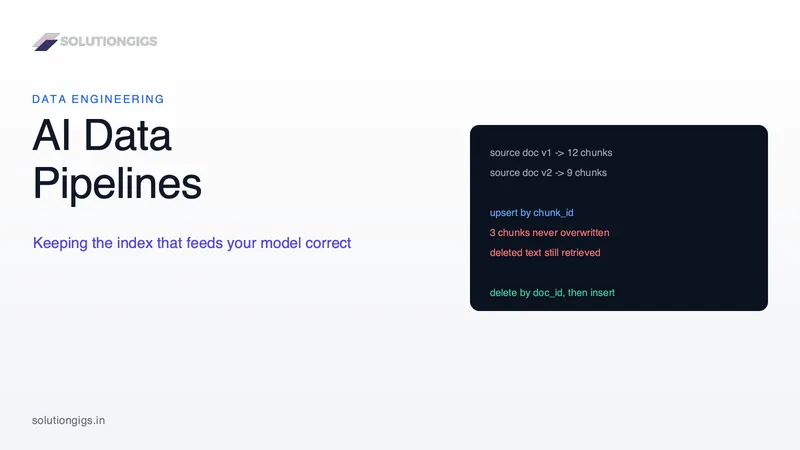
AI Data Pipelines: How to Build One That Doesn't Go Stale
An AI data pipeline is easy to build once and hard to keep correct. This guide covers the sync problems that only appear in production: the chunk-boundary trap that leaves deleted text retrievable, why vector deletions are harder than inserts, what an embedding model upgrade actually costs, and how to choose a freshness target you can defend. The core reframe: your vector index is a materialised view over your source content, so every one of these problems already has a known data engineering answer.
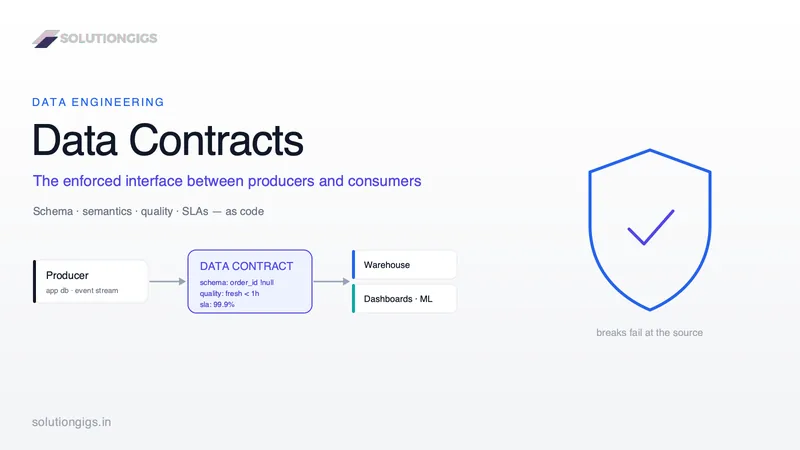
Data Contracts in Data Engineering: The Complete Guide
An upstream column rename shouldn't silently break your dashboard. A data contract is an enforced, version-controlled agreement between data producers and consumers — schema, semantics, quality and SLAs as code. Learn what data contracts are, the ODCS standard, a real YAML example, and the four ways to enforce them: dbt model contracts, schema registries, CI gates and quality tests.